First published 11 February 2023. Last updated 19 February 2023.
Introduction
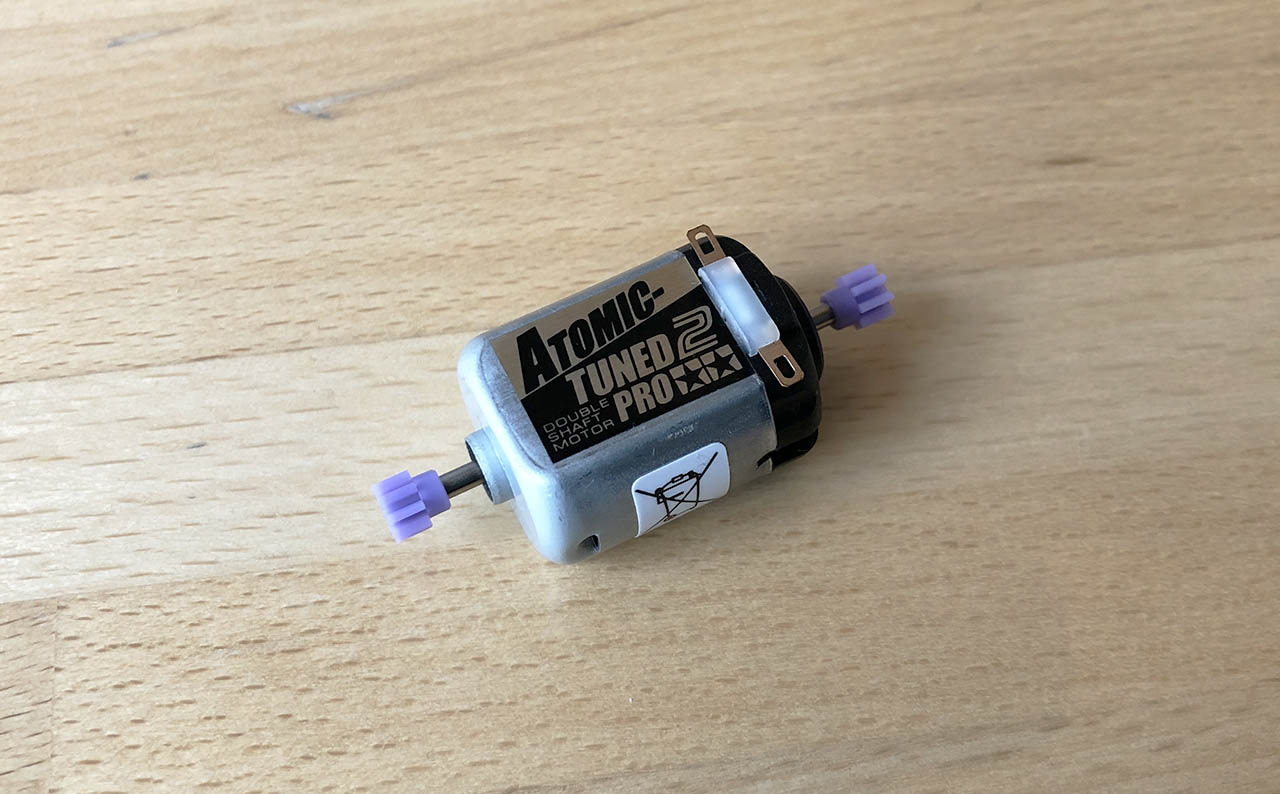
Tamiya Atomic-Tuned PRO (double shaft) motor is one of the three tuned motors. It meant to be the balance one between Torque-Tuned (best acceleration) and Rev-Tuned (best top speed). So what is the top speed and the torque of the motor in real life? Does it match the official spec from Tamiya? Let's do some experiments to find out.
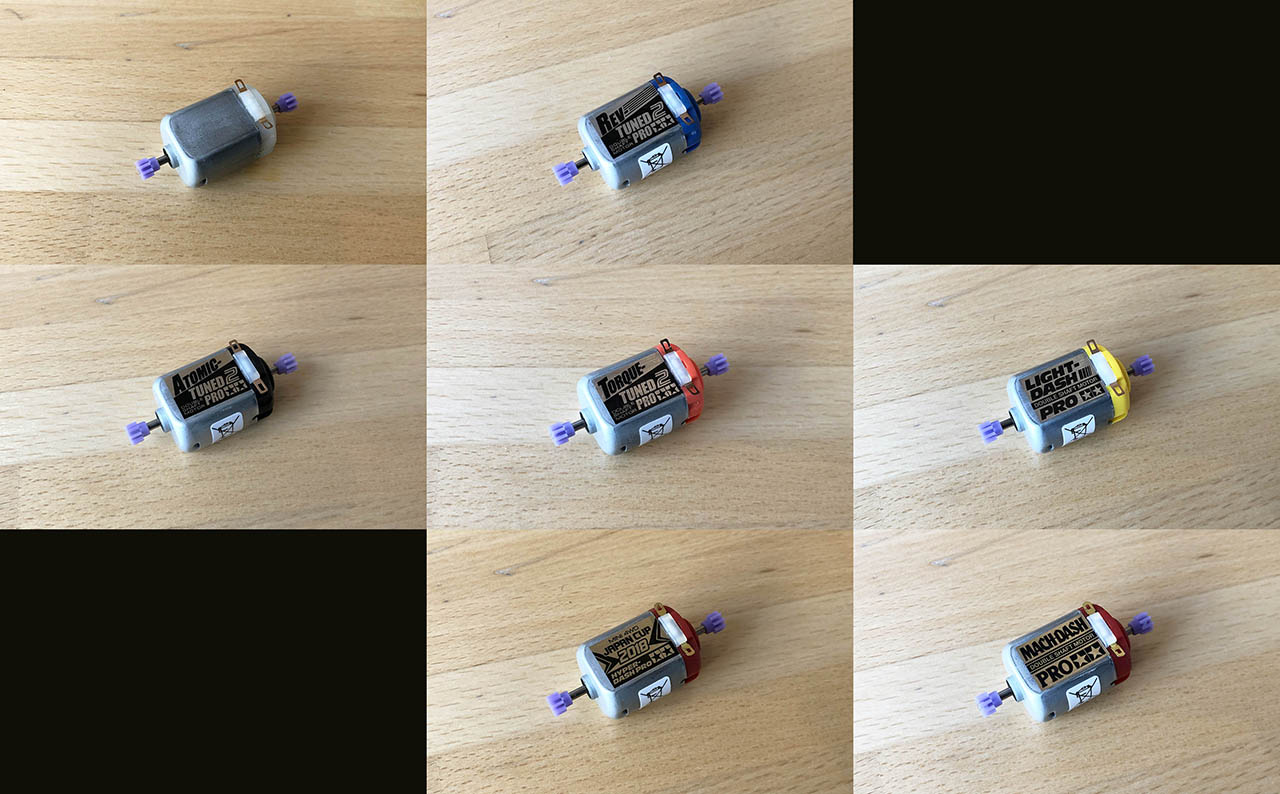
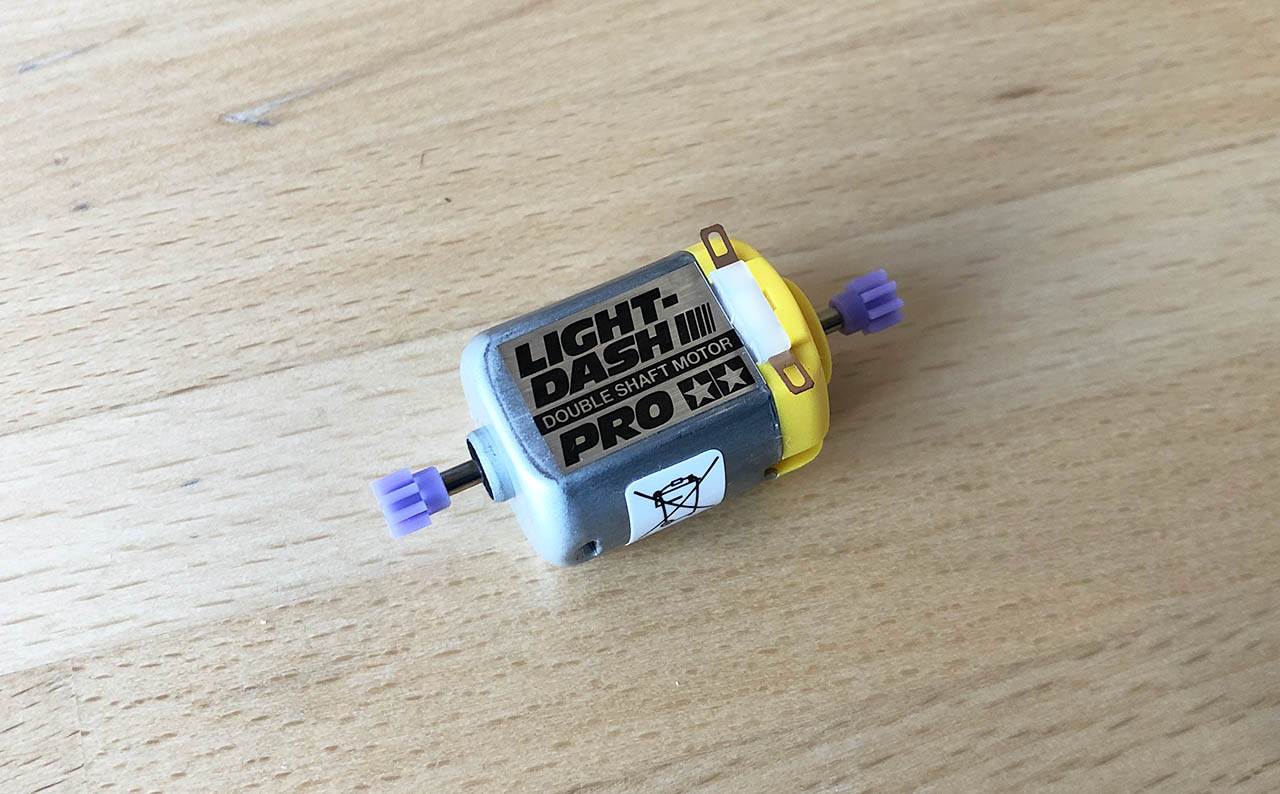
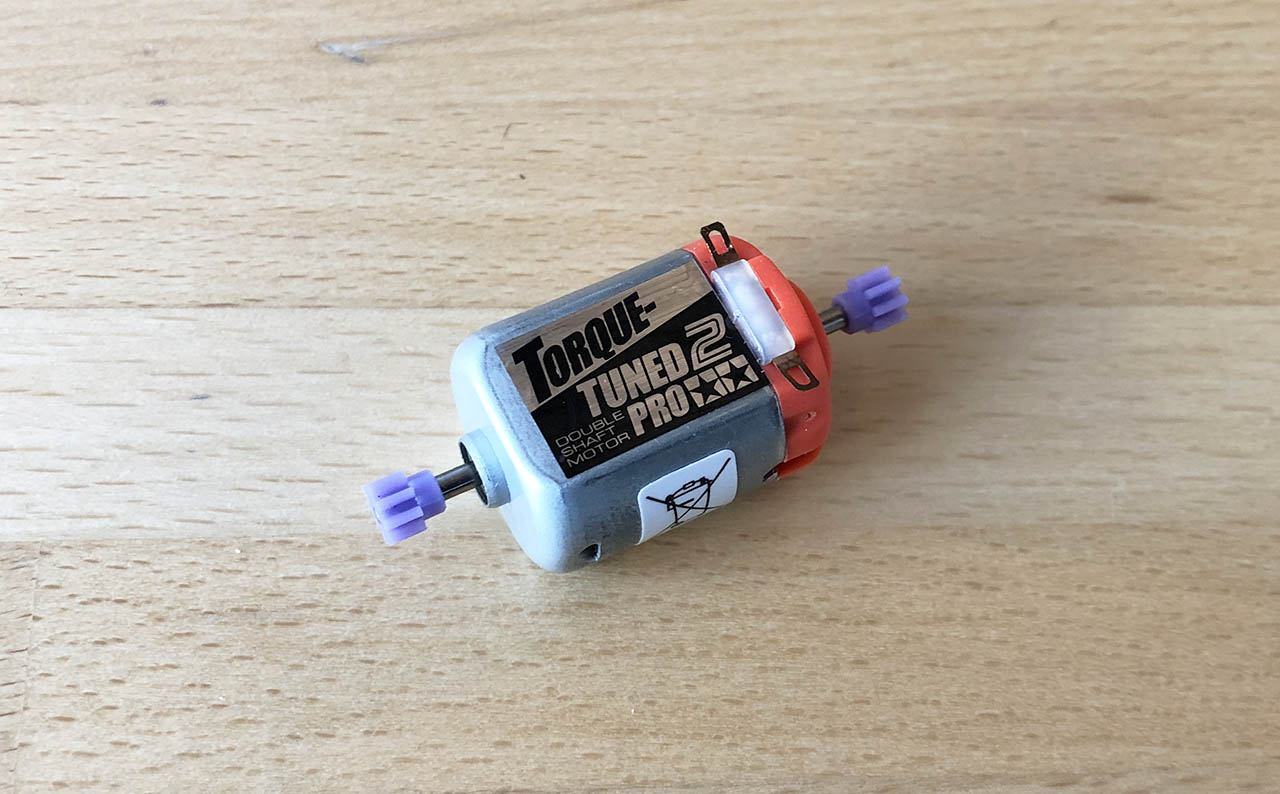
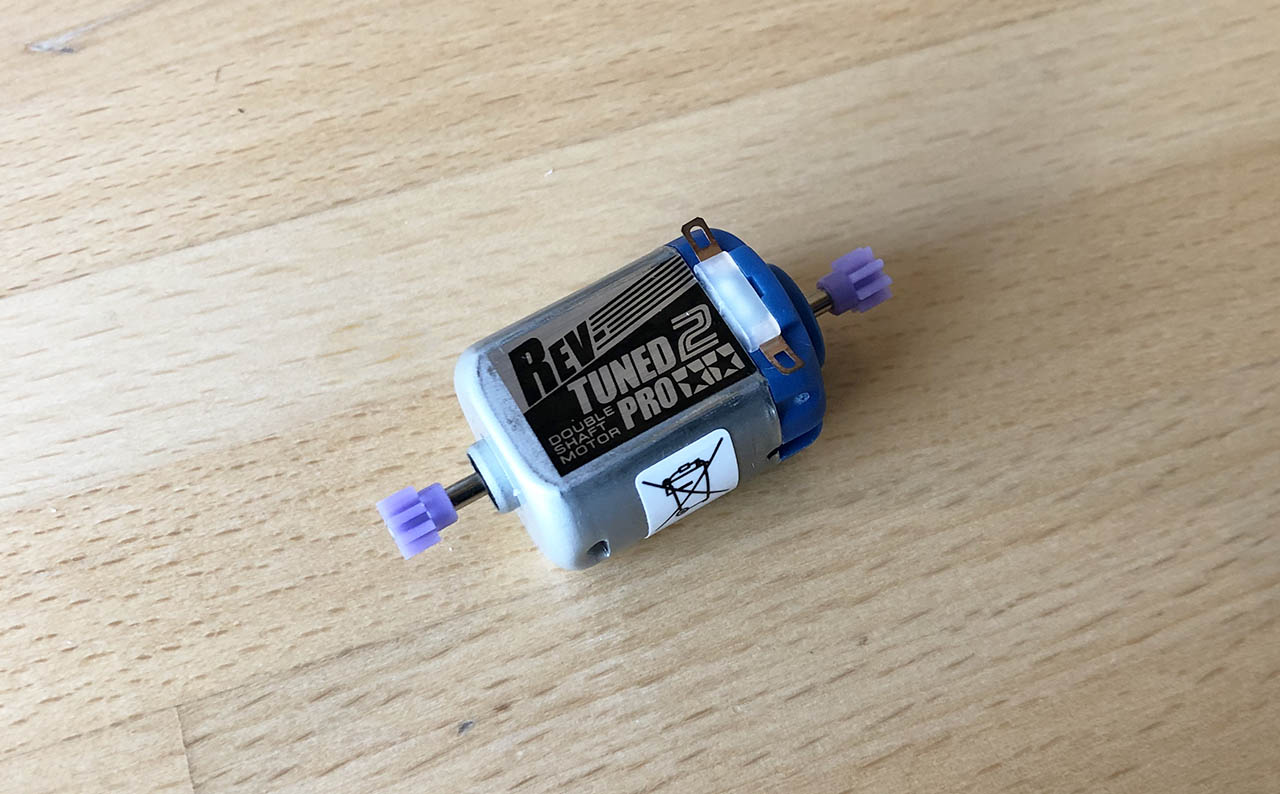
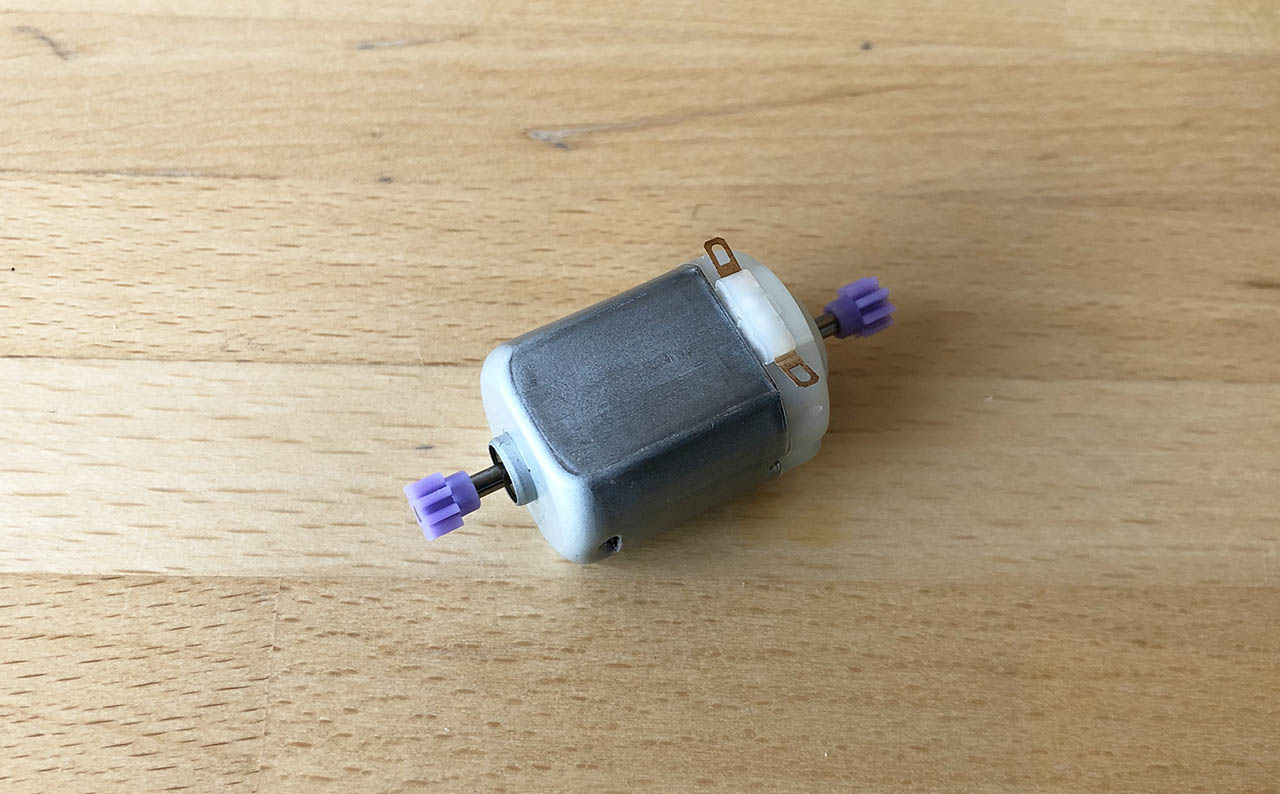
This is part of the PRO motor test series. We are testing all seven PRO motors: Stock PRO, Rev-Tuned 2 PRO, Atomic-Tuned 2 PRO, Torque-Tuned 2 PRO, Light-Dash PRO, Hyper-Dash PRO and Mach-Dash PRO. A report will be written for each, followed by comparison reports ((Tuned compared, Dash compared, All PROs compared)). So watch this space.

Estimating top speed and acceleration
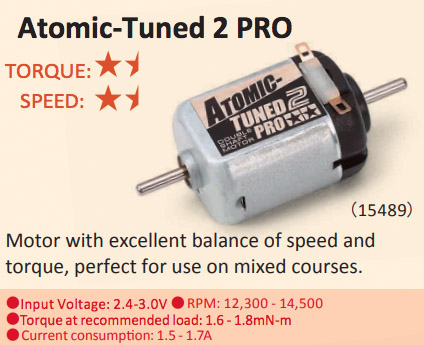
Based on the information from the Tamiya's Mini 4WD motor chart that we can find on the Mini 4WD Setup guide webpage, the Atomic-Tuned 2 PRO motor has the follow performance characteristics:
- Recommended Torque Load 1.5 - 1.7mNm
- RPM: 12,300 - 14,500 r/min
Using the conversation formula that was mentioned in the previous article. We can calculate that the top speed is around 4.2 to 4.95 m/s and the acceleration is around 2.59 to 2.93 m/s2.
Test track
We are going to be testing the car in our two lanes Tamiya Mini 4WD Oval home circuit with extensions to make a bigger track with longer straights. We removed the bridge crossing. We will only use the outer lane to run the experiments
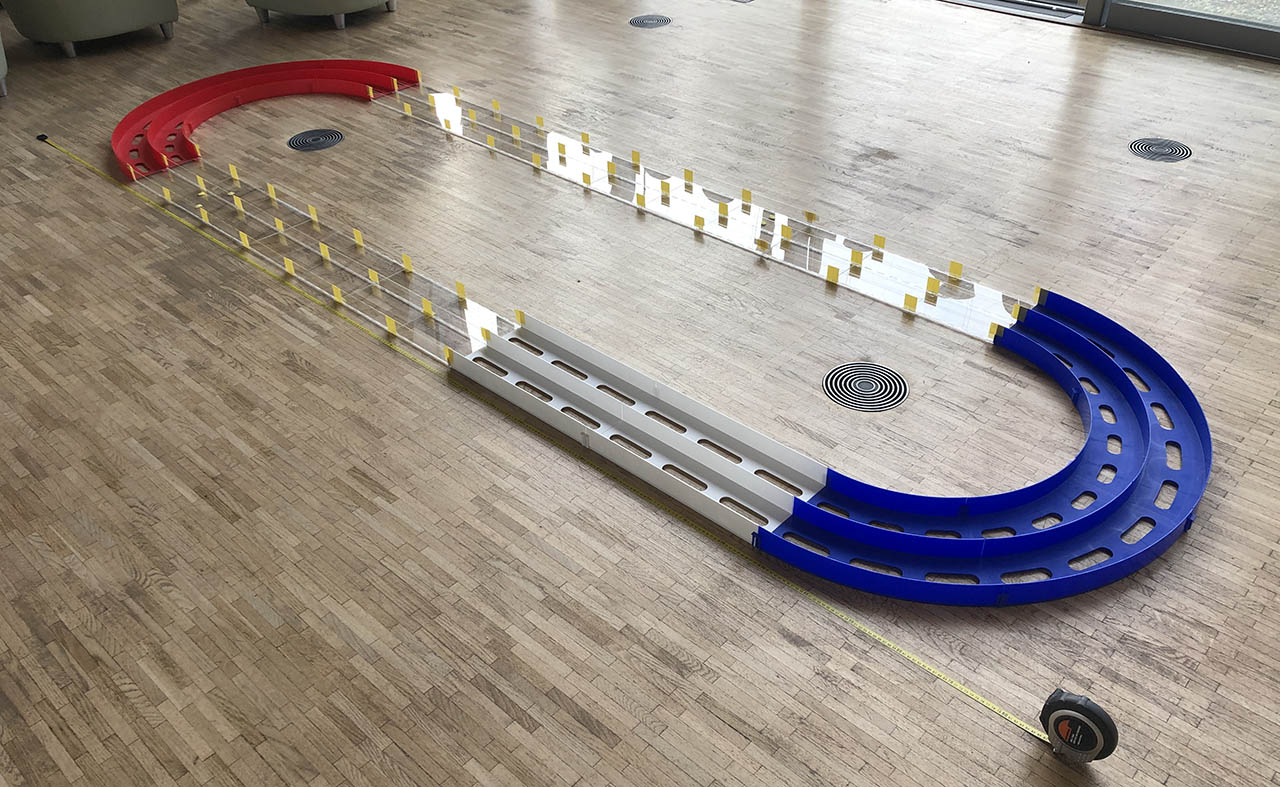
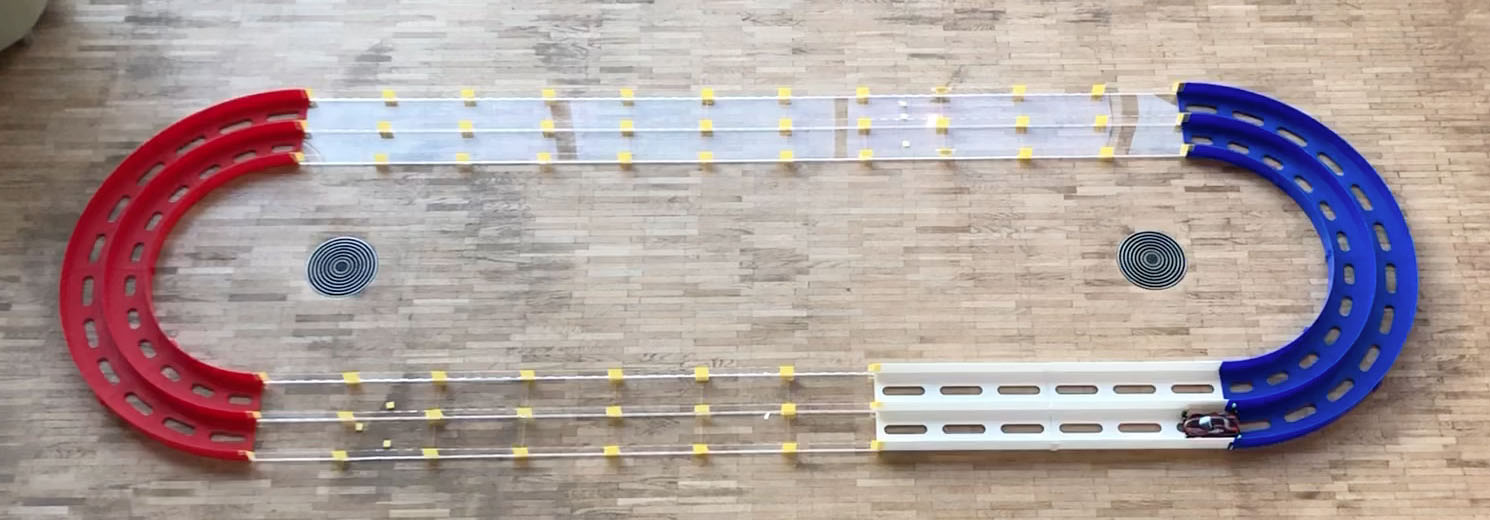
Based on data from Tamiya, we can calculate the length of the lap. We have 11 straight sections at 480mm length and two 180 turns with radius of 539cm ( ( 598mm - 480mm ) / 2 ) assuming the car travels in the centre of the lane.
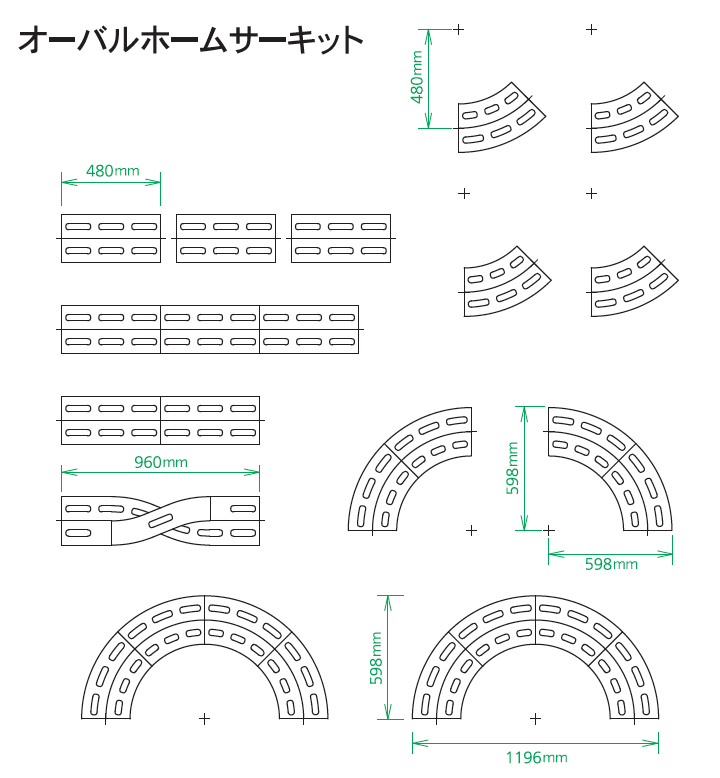
So the length of the circuit is ~8.66 metres long ( 11 × 480mm + 2 × PI × 539mm)
Test equipment
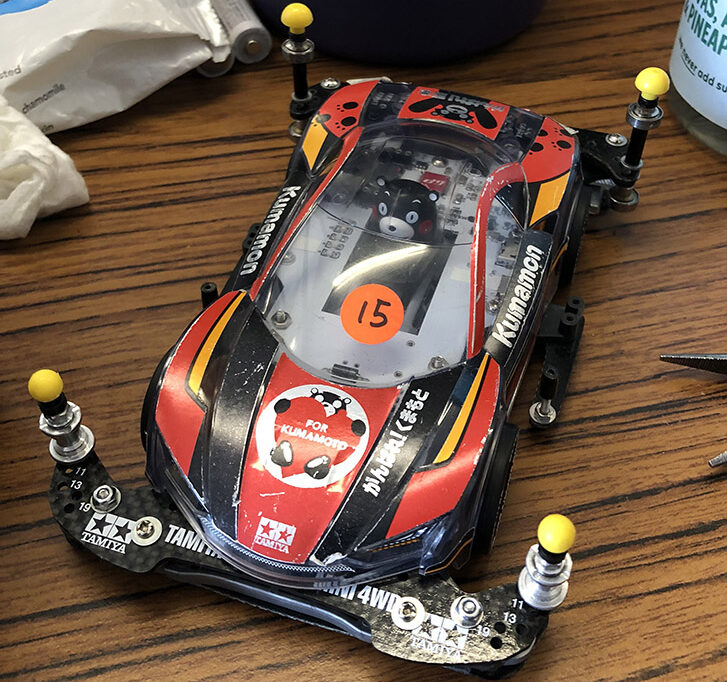
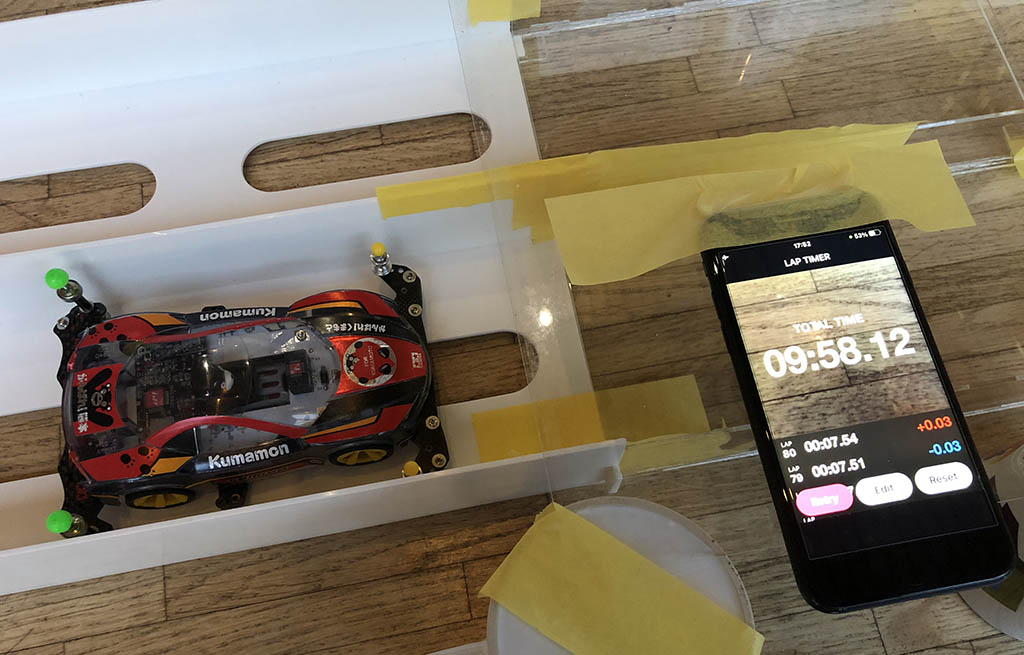
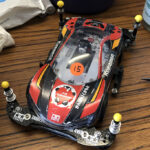
Car: Our Mini 4WD development prototype with telemetry data recording capability (see below) and Tamiya Raikiri cover (Tamiya 18640 Raikiri MA Chassis MINI 4WD)

Chassis: MA Chassis
Motor: Tamiya Atomic-Tuned 2 PRO
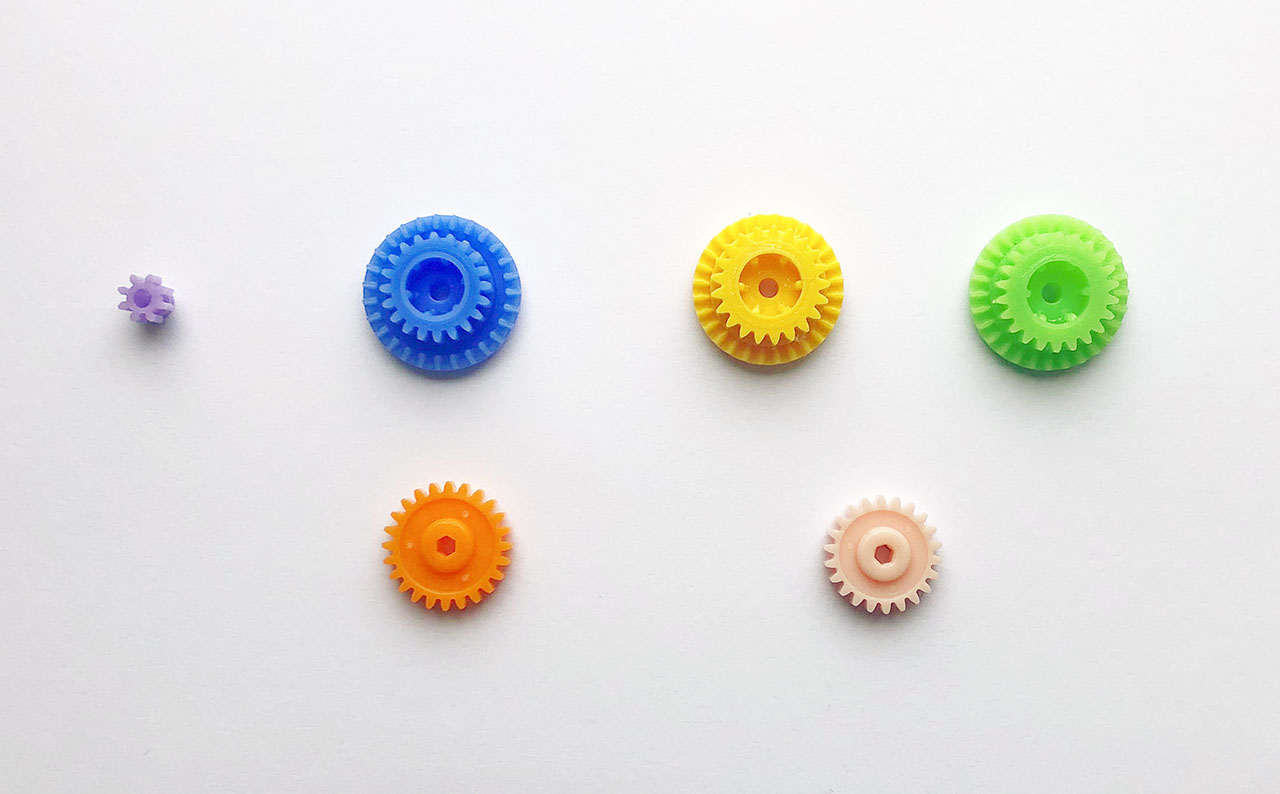
Gear Ratio: 4:1 (blue and orange)
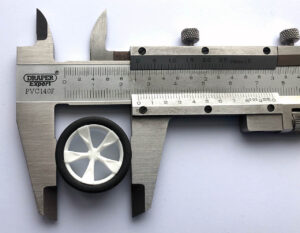
Wheel Diameter including tyres: 2.61 cm
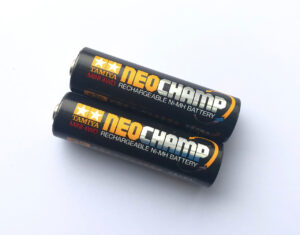
Battery: Tamiya Neo Champ 950mAh rechargeable batteries
Mass: 189 grams
Telematics:
- Adafruit Feather M0 Basic Proto - ATSAMD21 Cortex M0 48Mhz processor (Arduino Zero) to run the measuring program.
- 6-axis gyroscope and accelerometer (MPU6050) to measure acceleration and rotation
- A clock to measure time in milliseconds
- A tachometer to measure distance in centimetres.
- on-board data storage (Adafruit SPI Flash SD Card 512MB) to store the data recorded.
Test methods
We are going to run the car around the circuit on the outer lane in clockwise direction. starting from the START grid. We will do three runs and each run will last for 30 seconds. The batteries will be fully re-charged before each run. The motor will be given enough time to cool down to avoid performance loss.

The on-board computer captures readings e.g. tachometer and time every 10 milliseconds (0.01 seconds or 100 times a second) and stores each lines in the on-board storage in a CSV file format, which I can later download to the laptop for analysis after each run. The data will enable us to calculate speed and acceleration.
Calibration
As with many scientific experiments, one should calibrate the measuring equipment before conducting the experiment in order to produce a more accurate result. Here are the test results from previous experiment.
Tachometer accuracy test:
I used my desk to measure the accuracy of the tachometer. I measured the length of my desk, it is 120.2cm long. I measured the length of the Mini 4WD test car, it is 15cm long. If I manually and steadily move the test car from one end of the desk (rear bumper at the end) to the other (front bumper at the end), at a steady speed as much as I can and going as straight as possible, the car should have moved 120.2cm - 15cm = 105.2cm. So I ran this test three times and checked the readings from the tachometer. Here are the results from the three runs.
- 104.95
- 104.54
- 104.54
Average: 104.68 cm, error rate: ~0.4%. That's not bad at all. I probably didn't line up the car perfectly enough.
Clock accuracy test:
I tested the clock against a stop watch. To test the clock on the test car, I setup the test car to blink the on-board LED status light every 5 seconds. I used a stop watch to time the interval manually. I ran the test for about 35 seconds and here is the result:
- 00:00:05.136
- 00:00:04.891
- 00:00:05.040
- 00:00:05.062
- 00:00:05.098
- 00:00:04.945
Average: ~5.029 seconds, error rate ~0.6%. That's not bad at all. My reaction time probably caused the error.
So from the two tests, they show that the tachometer and the clock on-board are pretty accurate with very low error rate.
Considerations
Resistive forces such as air friction, mechanical friction and tyre friction can affect the outcome. The condition of my batteries e.g. charged voltage and internal resistance, motor condition e.g. run-in or worn out and electrical resistance in the circuit can also affect the outcome. Tyre skid is an issue as the tachometer will read the wheel turning motion even the car might not be moving as fast. We filmed the running of the car so we can compare the findings later.
Results
I downloaded the data from the on-board computer. Imported them to our custom made analytic web app. This analytical tool enables us to analyse the results, calculate performance figures and generate some nice charts.
1st Run
Here is a chart showing the speed of the car from the first run. We have speed in metre per second on the Y axis (vertical) and time in miniseconds on the X axis (horizontal).

The car accelerated from a standstill to about 5 m/s. Then the speed changed depending on whether the car was traveling in a straight section or a turn. In the straights, the car accelerated to faster speed and it slowed down when it entered the 180 degrees turn and continued to slow down until it exited a turn. Hence we see a saw tooth pattern on the chart.
Top Speed

The top speed of the car was 5.49 m/s. It happened at around 6.2 seconds. The Motor RPM was 16,080. We added a pair of green lines to highlight the top speed.
Average Speed

To get a representative average speed, we ignored the data during initial acceleration and the final slow down (marked by the grey areas), then we calculated the result using the data in the middle section. The average speed was around 4.62 m/s and Motor RPM was 13,526. (see blue line)
Acceleration

Similar to our previous experiments, the motor pushed the forward car the strongest from standstill and the acceleration decreased as the speed built up until it gradually flattened. The shape of the speed curve seems to look like a logarithmic curve. To keep it simple, we picked a spot where the acceleration seemed to have flattened and used that to calculate the average acceleration from standstill (see blue line). The result for acceleration from standstill was 1.56 m/s2.
To work out the Motor Torque, we can use this formula mentioned in a previous article.
Torque of motor (mNm) = Acceleration (in m/s2) / gear ratio × diameter of wheel (in centimetres) / 100 / 2 × mass(kg) × 1000
After putting all the figures in the formula, we get 0.82 mNm.
Now let's do the same analysis for the 2nd and 3rd run.
2nd Run
Here is a chart showing the speed of the car from the second run.

The performance is a bit more varied at the start and a bit more stable at the 2nd half.
Top Speed

The top speed of the car was 6.4 m/s. It happened at around 16.5 seconds. The Motor RPM was 16,4950.
Average Speed

The average speed was around 4.96 m/s and Motor RPM was 14,524. (see blue line)
Acceleration

The acceleration was 1.7 m/s2 and the motor torque was about 0.89 mNm.
3rd Run
Here is a chart showing the speed of the car from the third run.

The performance seems very consistent this time.
Top Speed

The top speed of the car was 5.49 m/s. It happened at around 8.9 seconds. The Motor RPM was 16,080.
Average Speed

The average speed was around 4.84 m/s and Motor RPM was 14,168. (see blue line)
Acceleration

The acceleration was 2.48 m/s2 and the motor torque was about 1.28 mNm.
Combined
Let's put the key results together in a table
1st Run | 2nd Run | 3rd Run | Average | |
Top Speed (m/s) | 5.49 | 6.4 | 5.49 | 5.79 |
Top Speed Motor RPM | 16,080 | 18,720 | 16,080 | 16,960 |
Average Speed (m/s) | 4.62 | 4.96 | 4.84 | 4.81 |
Average Speed Motor RPM | 13,526 | 14,524 | 14,168 | 14,073 |
Acceleration from standstill (m/s2) | 1.56 | 1.7 | 2.46 | 1.91 |
Motor Torque from standstill (mNm) | 0.82 | 0.89 | 1.28 | 1 |
Let's put some of the key figures into a chart:
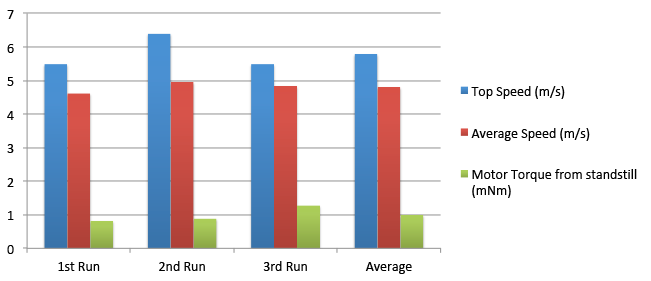
It seems like the motor torque improves after every run. Our Atomic-Tuned 2 PRO motor was brand new, so it seems like it does benefit from "run-in" to get the most performance.
In Summary
We set out to measure the performance of the Tamiya Atomic-Tuned 2 PRO motor and we got some interesting results.
- The top speed of the car (on average) was 5.79 m/s with motor RPM at 16,960.
- The average speed of the car (on average) was 4.81 m/s with motor RPM at 14,073.
- The motor torque measured from standstill was 1.0 mNm.
- The speed of the car increased in the straight sections and decreased in the turns.
- We noticed the performance is quite consistent.
Here is a reminder of the official motor spec from Tamiya:
- Recommended Torque Load 1.5 - 1.7mNm
- RPM: 12,300 - 14,500 r/min
Let's compare our derived torque value based on measured average acceleration from standstill with Tamiya's recommended torque load (note, this is not necesary the right comparison but it's a start). The motor torque performance is a little bit below spec 1.0 mNm (measured average) vs 1.5-1.7 mNm (on paper), the best result we got was 1.28mNm.
Let's compare our motor RPM value based on measured average speed with Tamiya's official RPM range. Our RPM value is on spec with 14,073 (measured average speed) vs 12,300 - 14,500.
We noticed the motor torque improved every run so perhaps the motor needs running in to perform well or we happen to have an unlucky batch. There is also the chances of human error when selecting an appropriate data point to measure acceleration.
All in all, the results were not bad compare to offical spec.
What does the result mean to fellow racers?
We have validated the performance of a Tamiya Atomic-Tuned 2 PRO motor. Our motor did not performed completely on spec. The motor seemed to perform better over time, perhaps it is a motor that needs running in. We observed that the acceleration of the motor was not linear (similar to many of the motor we have tested so far). There was a strong initial push and then it tailed off. The speed changes depends on whether the car was going through a straight section or a turn. The longer the straight, the higher the speed, the longer the turn, the more it slows down. So small track differences would result in different traveling speed over an obstacle. As a result, they add variance to your setup. The variance could be the reason why sometimes your car jumped over an obstacle and landed perfectly and sometimes it didn’t.
This experiment is by no means conclusive. Your setup might be different from ours which would create different results. But we hope that it provides you an interesting insight to the subject matter.
What would you take away from this experiment? How would you improve it? Please feel free to leave a comment on our Facebook page @Mini4Science.

![7 different Tamiya Mini 4WD low profile small diameter tyres [Item no: 95208, 95205,95152, 95281, 95304]](https://mini4science.com/wp-content/uploads/2024/09/IMG_0538_mod2-150x150.jpg)
![8 different Tamiya Mini 4WD metal rollers [Item no: 95612, 15522, 95643, 95497, 15426, 95160, 15345, 15475]](https://mini4science.com/wp-content/uploads/2024/07/IMG_0296-150x150.jpg)


![7 different Tamiya Mini 4WD low profile small diameter tyres [Item no: 95208, 95205,95152, 95281, 95304]](https://mini4science.com/wp-content/uploads/2024/09/IMG_0538_mod2.jpg)
![8 different Tamiya Mini 4WD metal rollers [Item no: 95612, 15522, 95643, 95497, 15426, 95160, 15345, 15475]](https://mini4science.com/wp-content/uploads/2024/07/IMG_0296-scaled.jpg)

