![7 different Tamiya Mini 4WD low profile small diameter tyres [Item no: 95208, 95205,95152, 95281, 95304]](https://mini4science.com/wp-content/uploads/2024/09/IMG_0538_mod2.jpg)
Background
Choosing the right tyres is one of the most challenging tasks of a Mini 4WD racer, getting it right might not guarantee a win, but getting it wrong will most likely guarantee a loss. In the early years, it was a popular thing for racers to swap their standard rubber tyres to different foam tyres upgrades as the standard rubber tyres were really bad for cornering. Nowadays there are so many different rubber tyres on offer, from low friction to super hard. Rubber tyres have become a popular choice.
As there are so many choices on offer (e.g. kit-standard, low friction, super hard and offset etc…), it is very hard to know which one to choose. Hence we conducted a scientific experiment to find some answers and gain valuable insight into choosing the right tyres.
Measuring Tyre Grip
We needed to measure two things (1) Grip, (2) bounce. We started by looking into measuring grip.
By feeling
One way to compare tyres is by testing them on the worktop and feeling the grip as seen in this video on Youtube.
Points for choosing tires! I will teach the settings for wheels and tires! by T-ヒロキ ホビー/T-Hiroki hobby ch
Although it can give you an idea of how different tyres compare with each other, we won’t be able to quantify the difference for example how much less grip low friction tyres compare to kit-standard tyre. Besides, the grip is different on different surface, so it is better to test the tyres on the same material as the race track.
By track testing
Another way to compare tyres is by testing them on a track and measuring the lap time, as seen in this video on Youtube
Tamiya Mini 4WD Testing: Best Tire Compound by Z3N Bluster
This is a better method and we can see the performance of different setups. However there are many other factors that can have an effect to the overall performance such as rollers condition, battery condition, motor condition and drivetrain condition etc… We noticed this variance in our motor performance measurement experiments before. So it is very hard to proof that it was really the tyres that contributes to the performance change. Is there a better way to measure the tyre grip? Let’s look into science.
With science – the science of measuring friction on a surface
The tyre grip is generated by the friction between the tyre and the surface. The lower the friction, the less grip we get. The higher the friction, the more grip we get. We need to measure the friction co-efficient of the tyres on a Tamiya race circuit so that we can compare them quantitatively.
Frictional force on a surface
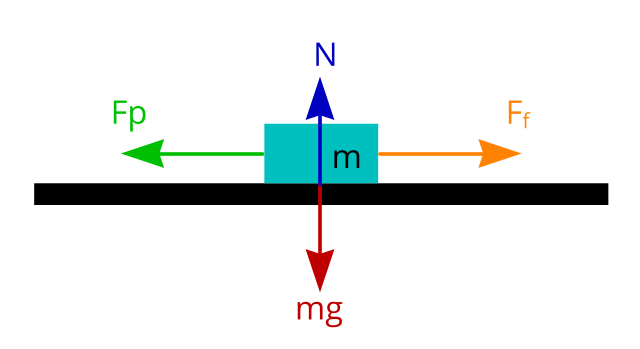
Force is measured in Newtons
m is the mass of the object (in kg)
g is the gravitational acceleration (in metre per second square m/s2). Gravitational acceleration on earth is pretty much constant. We are going to use 9.81 m/s2 in our experiment.
mg is the mass of the object × gravitational acceleration. If an object has a mass of 2kg, then the force acting on the surface through gravity is 2 × 9.81 = 19.62 Newtons
N is the normal force. Since the object is not accelerating downwards through the ground, the ground is exerting the same amount of force (normal force) upwards to keep the object in place, so N is also 19.62 Newtons.
Fp is the force pulling the object to the left. If the pulling force is less than or equal to the frictional force (Fp <= Ff ) the object will not move. But if the pulling force is greater than the frictional force (Fp > Ff), the object will start moving to the left.
Frictional force (Ff) is measured in Newtons.
Frictional force Ff = μ N
Where
μ is the static frictional coefficient (μs) or kinetic frictional coefficient (μk)
N is the normal force (in Newtons).
Static frictional coefficient is measured when the object goes from static (not moving) to moving.
Kinetic frictional coefficient is measured when the object continues to move despite the friction between surfaces but not accelerating or decelerating. E.g. the car keeps sliding at a constant speed.
Therefore:
Frictional coefficient = Frictional force ÷ Normal force ( μ = Ff ÷ N )
Since we can measure m and we know g. We can calculate N as N = mg. If we can steadily increase the amount of pulling force (Fp) until the object starts to move. We can calculate the frictional coefficient.
Hence:
Frictional coefficient = Pulling force ÷ mg
Learn more about friction in our Science 101 friction article here
So if we design an experiment based on this scientific formula, we can measure the friction coefficient of the tyres. Then we can compare and rank them accordingly.
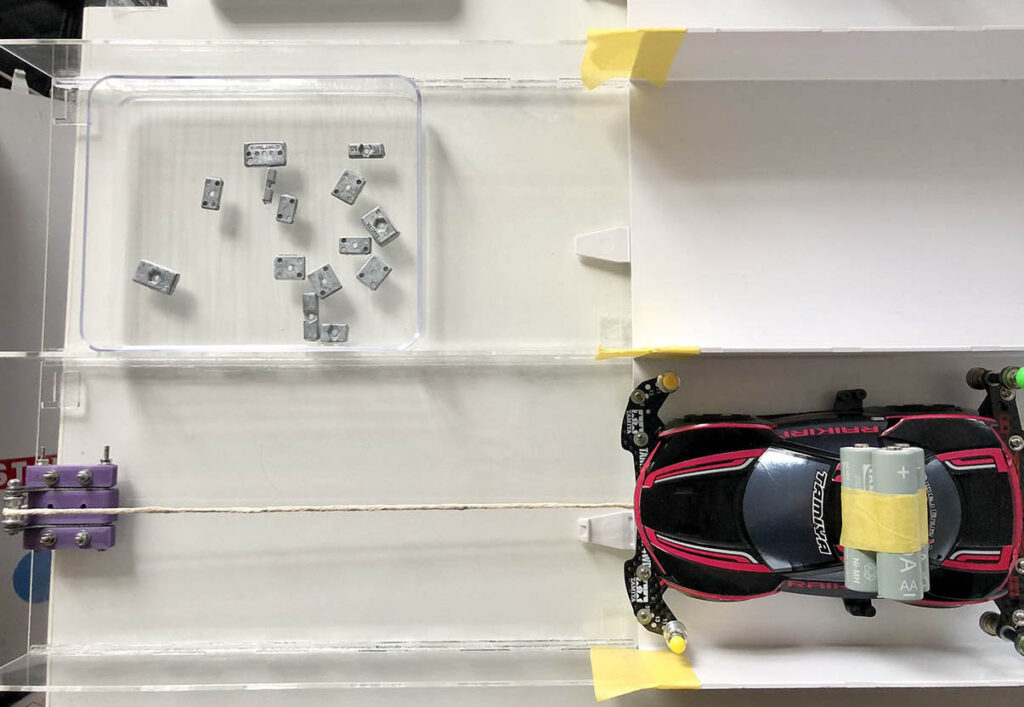
The Setup
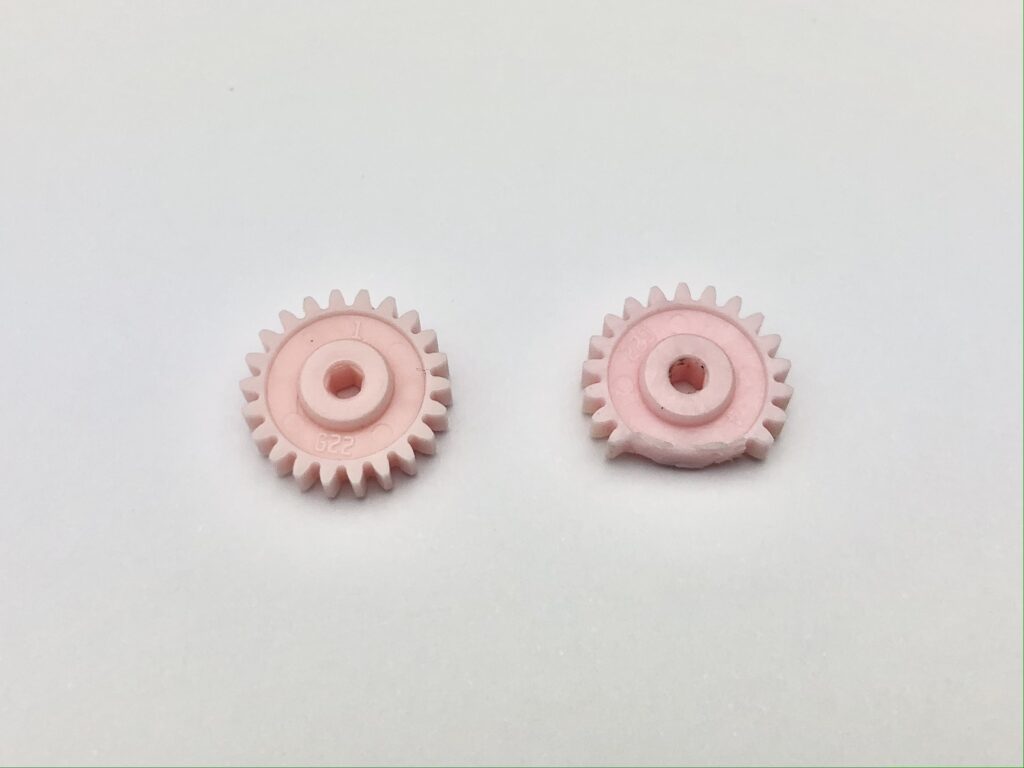
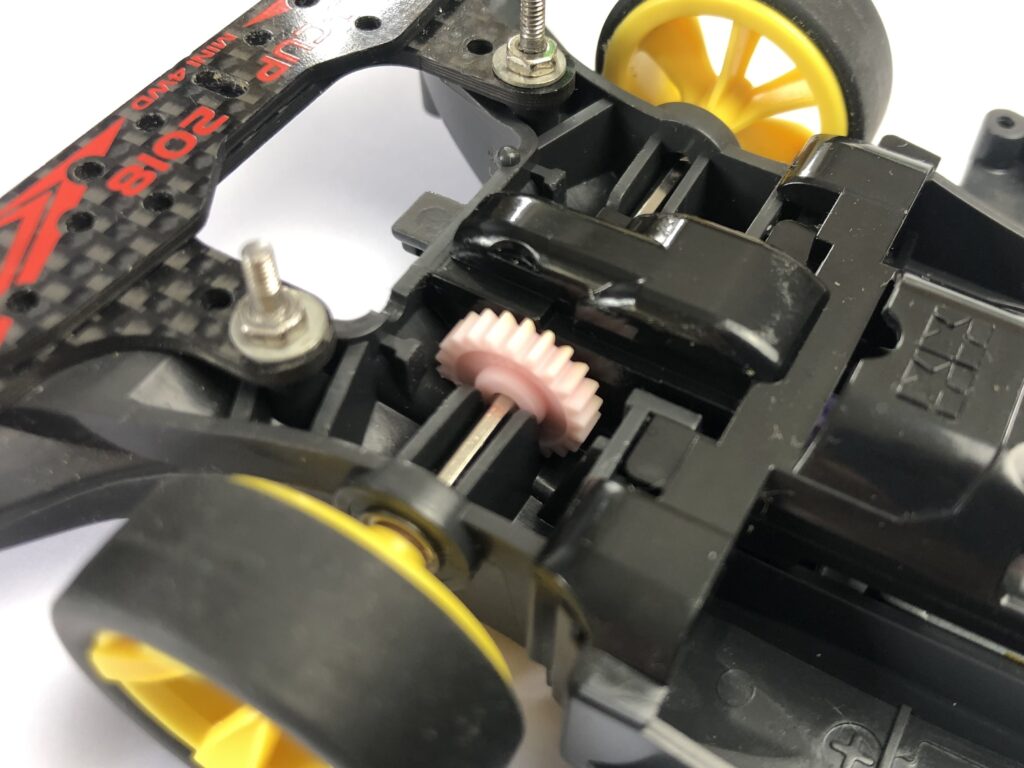
We modified our Mini 4WD so that the axels were locked which stopped the wheels from rotating. We did this by cutting a spare gear to a shape that would fit on the side of the gear housing.
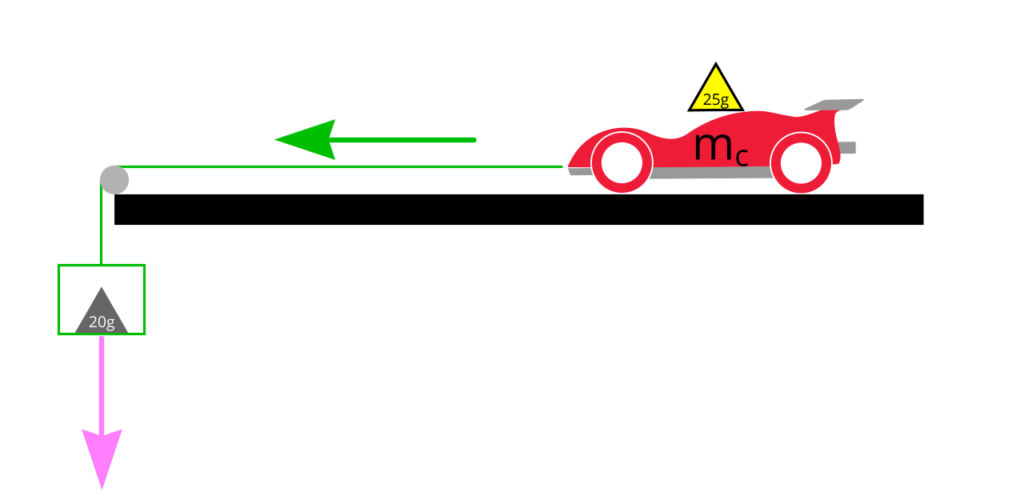
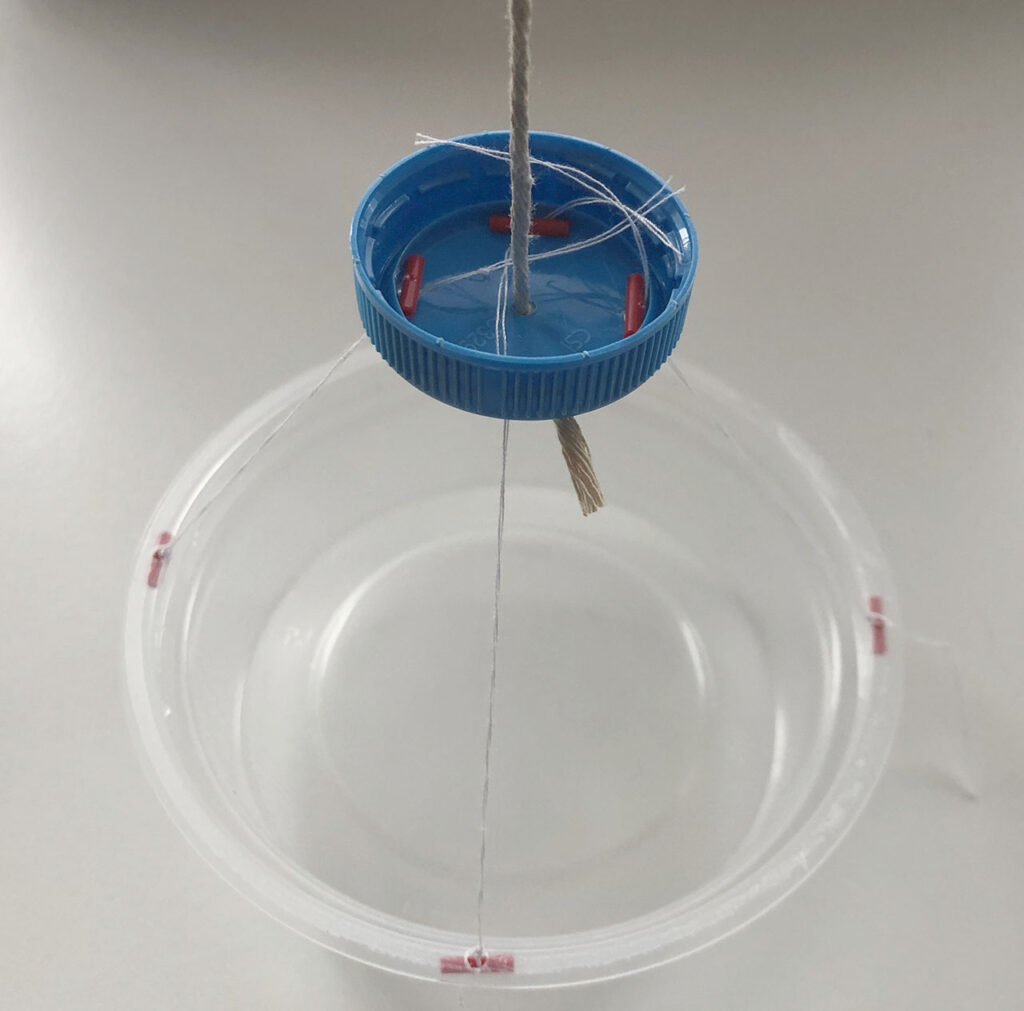
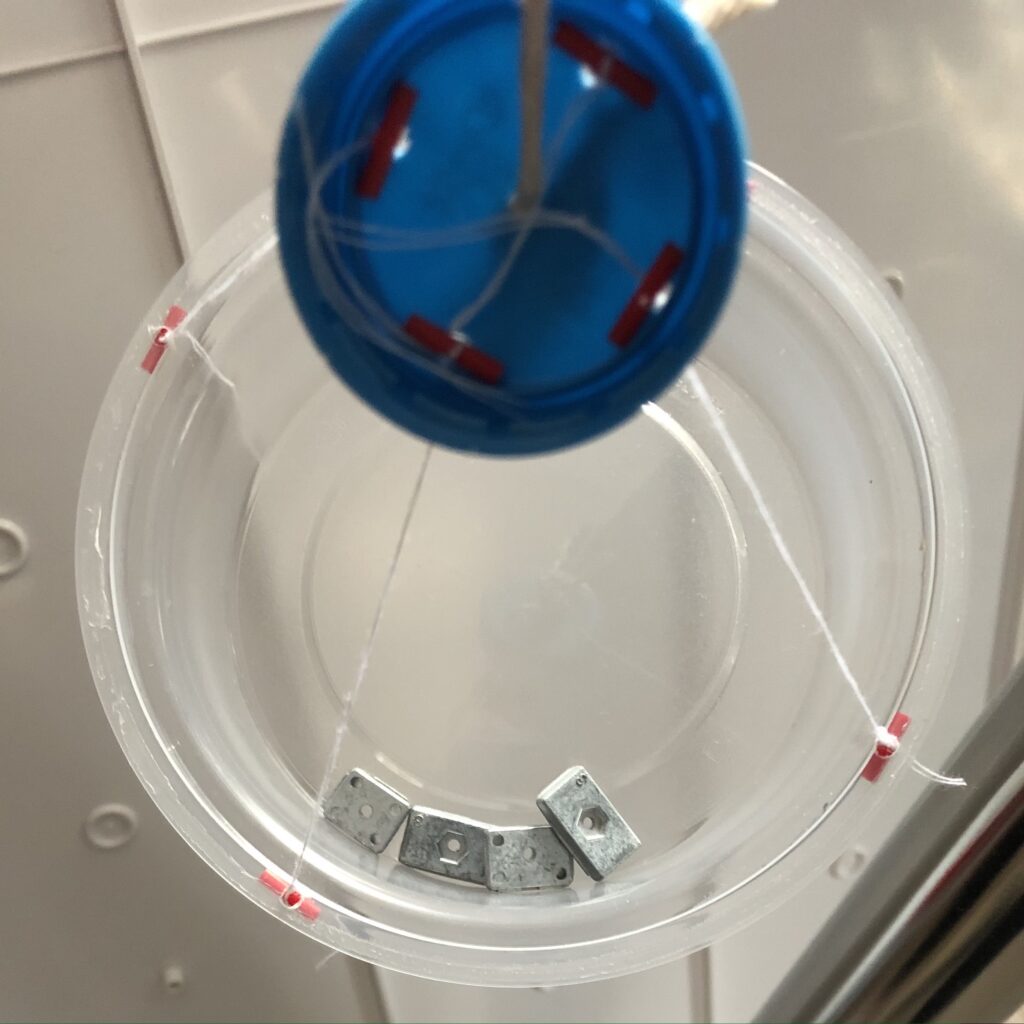
We made a basket (on the left of the diagram) to hold some weights (e.g. Tamiya multi chassis balance weight). The basket is made up of light-weight recycled material and the total mass including part of the rope is around 10.5 grams.
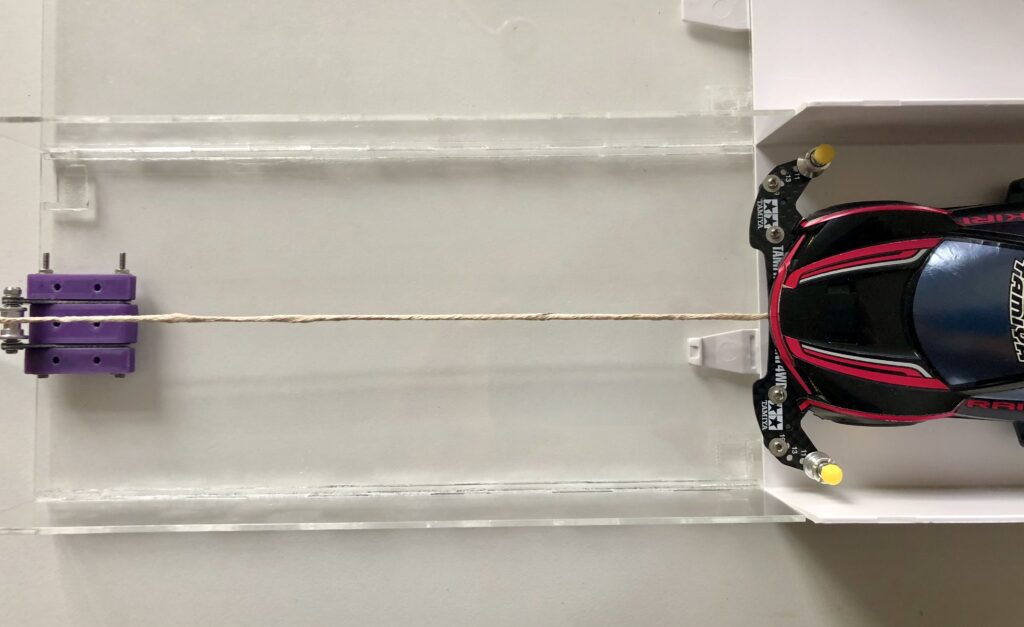
The basket was connected to the cart with a rope passing over a custom made pulley.
By adding weights in the basket, we generated pulling force using gravity. Then we added weights in the basket until the carts started moving in a very slow and steady pace. We recorded the result in a spreadsheet. Unfortunately, since this part was based on observation, there would be a risk of measurement errors. Hence we repeated the experiment several time and used statistical methods to help reduce the errors.
The test surface was based on a Tamiya Junior Circuit straight section.
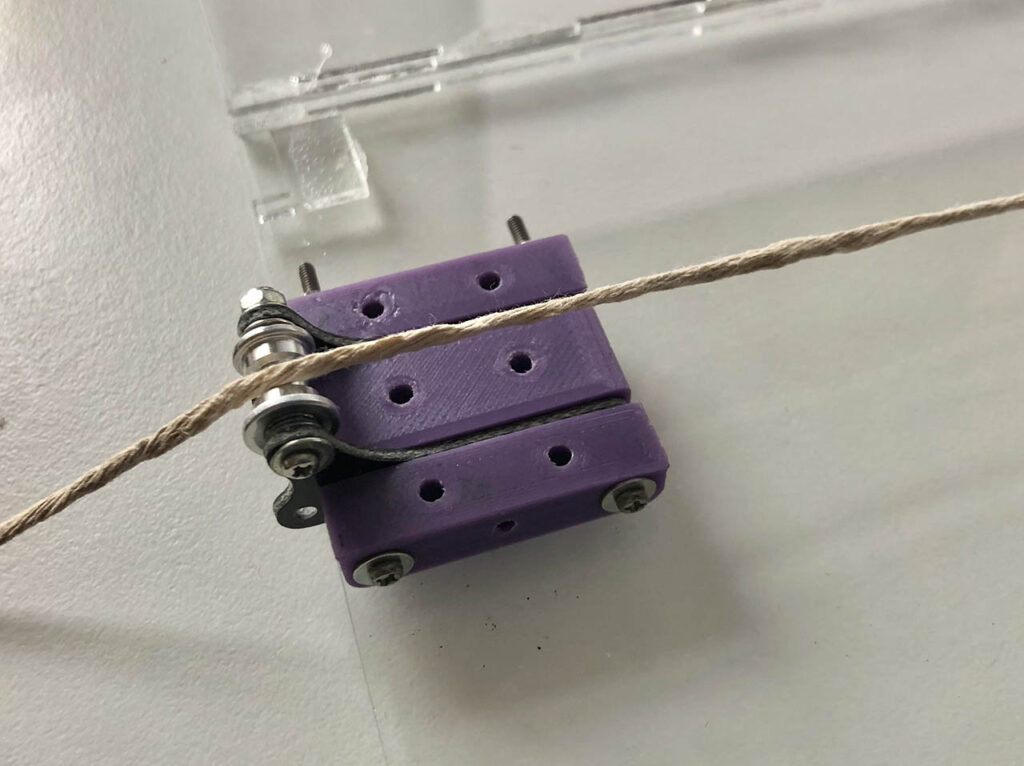
The pulley was made of a Mini 4WD ball-race double roller to minimise friction. It was supported by FRP fibre glass strips and 3D printed mounts to give it extra strength. It was mounted on our custom made short straight track section.
The rope was the strongest and the lightest we could find conveniently in the lab.
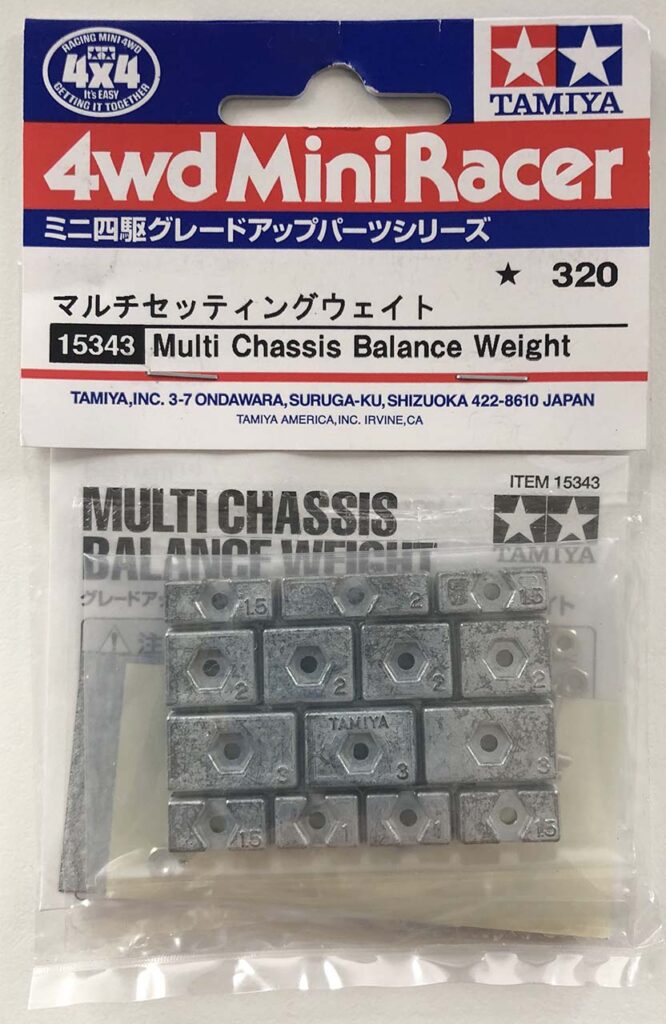
For weights in the basket, we were using Tamiya multi chassis balance weight [Item No: 15343] and whatever heavy things we could find on the workbench. This is illustrated as a grey 20g weight in the diagram above.
The Forces
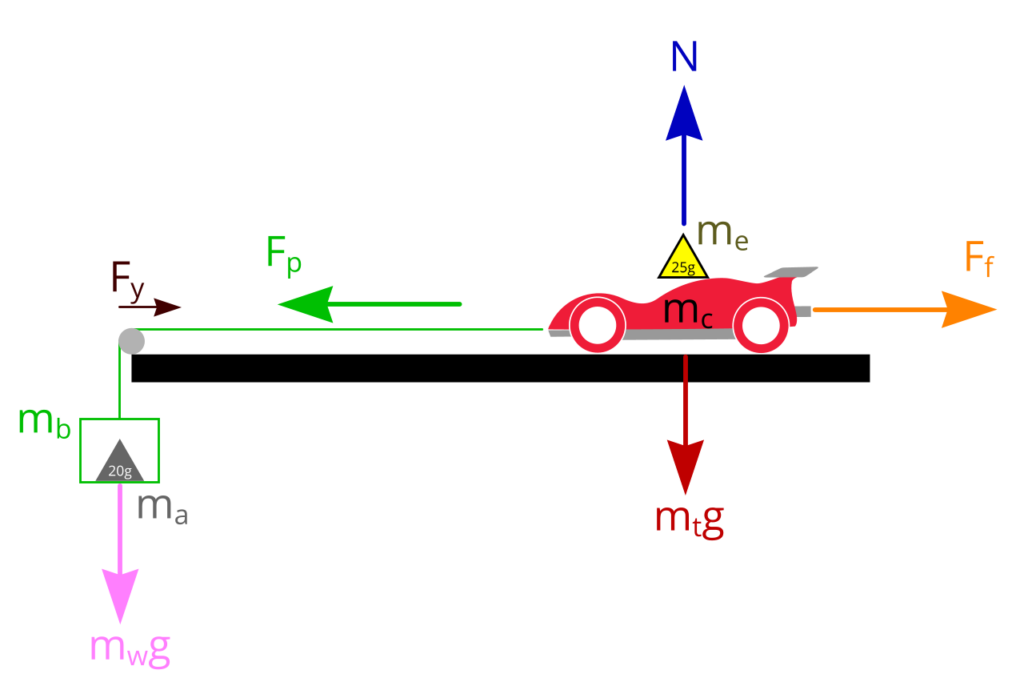
Gravitational acceleration: g = 9.81 m/s2
Mass of the car: mc
Extra weights on car (as illustrated by the yellow 25g weight): me
Gravitational force on car is Mtg = ( mass of car (mc) + mass of the extra weight (me) ) × g
Normal force on 4 tyre: N = mtg
Mass of basket: mb
Mass of weights on basket (as illustrated by the grey 20g weight): ma
Total mass on basket: mw = mb + ma
Pulling force: Fp = mwg
Although the formula for frictional force is: Frictional force (Ff) = friction coefficient (μ) × Normal Force (N)
Since we have a pulley in the system there will be a small amount of friction (rolling frictional force) on the pulley. Let’s call this Fy.
Therefore:
Total Frictional Force (Ft) = Frictional force on the tyres (Ff) + Frictional Force on the pulley (Fy).
From previous experiments, we discovered that the Frictional Force on the pulley (Fy) is tiny. Hence we just assumed Frictional Force on the pulley (Fy) = 0;
Therefore:
Total Frictional Force (Ft) = Frictional force on the tyres (Ff) + 0
Ft = Ff
Then
Frictional force (Ff) = friction coefficient of tyres (μ) × force acting on the tyres (mtg)
When Pulling force: Fp > Frictional force (Ff), the car will start to move. To keep it simple we will just assumed Pulling force (Fp) = Frictional force (Ff) in our calculation.
Re-arranging the formula to get friction coefficient, we get:
Friction coefficient of tyres (μ) = Pulling force (Fp) ÷ Normal force on the tyres ( (mass of car (mc) + mass of the weight(me) ) × gravity )
Friction coefficient of each tyre = Friction coefficient of tyres (μ) ÷ 4
The Tests
We will be testing each set of tyres five times. Starting with the car’s own weight, then add one AA battery (~25g), two AA, three AA and finally with the 100g test weight. As illustrated as a yellow 25g weight in the diagram. There will be 4 increments, hence five test results for each set of tyres.
We find the Pulling force (Fp) required to move the car by adding weights in the basket. We continue adding weights until the car starts moving in a very slow and steady pace.
Then put the weights into our precision electronic scale to measure the total weight. The results (two values) are recorded in a spreadsheet.
We can calculate the pulling force by adding the weight and the basket and then multiply the sum with gravitational acceleration 9.8m/s2.
We can calculate the Normal Force by multiplying the weight acting on the pad with gravitational acceleration.
All in all, there will be 35 sets of readings.
Checks
We checked that the test track is level. We make sure the rope (line) is as level as it can and as straight as it can to minimise errors.
We made sure the scale was calibrated before use. We also made sure the scale was reading zero at the start of every measurement.
We made sure the test surfaces (track and tyres) are clean.
Assumptions
As mentioned previous section, we noticed that the friction of the pulley system is tiny. To keep things simple we will assume that the friction of the pulley system (Fr ) is zero.
Pulling force (Fp) = friction coefficient of tyres (μ) × weight acting on the tyres (mtg) + Pulley frictional force (Fr)
Becomes:
Pulling force (Fp) = friction coefficient of tyres (μ) × weight acting on the tyres (mtg)
We will use 9.8m/s2 for gravitational acceleration.
Errors
When deciding whether the car is moving at a very slow and steady pace, it is based on subjective judgement, so there is a chance for error. We tried to mitigate this issue by varying the weight in smaller increments when reaching the tippling point and we sometimes repeated the experiment with smaller total to double check.
We noticed the Tamiya chassis weights are not exact (i.e. 2 grams weight is not exactly 2 grams); hence we used the precision electronic scale instead of adding the numbers up from the markings.
Measuring Tyre Bounce
The simplest way to measure bounce is simply to drop the object from a fixed height and measure the height of rebound. If the rebound height is close to the drop height, it means the object is bouncy (e.g. a basketball), but if the rebound height is much lower, the object is more rigid (e.g. lead ball). How do we compare bounce of different tyres?
By Observing
One way to compare tyre rebound is to simply drop the tyres on the worktop and see how they bounce as seen in this video on Youtube.
Points for choosing tires! I will teach the settings for wheels and tires! by T-ヒロキ ホビー/T-Hiroki hobby ch
But since the bounce can vary depending on how the tyres were dropped and the bounce happens so quickly, this isn’t a reliable way to get any truly meaningful result. So what can we do to improve this?
With science – the science of measuring bounce rate
The dropping method is a viable option; we just need to improve it so that we can quantify the result. Let’s look into science:
Science has provided us some formula to calculate the rate of bounce, which is called Coefficient of Restitution (COR).
In this experiment, we will be using this formula:
Coefficient of Restitution = Square root of ( height of rebound ÷ height of drop )
Height of drop: hi
Height of rebound: hr
Coefficient of Restitution: Cr
Cr = √(hr ÷ hi )
The Setup
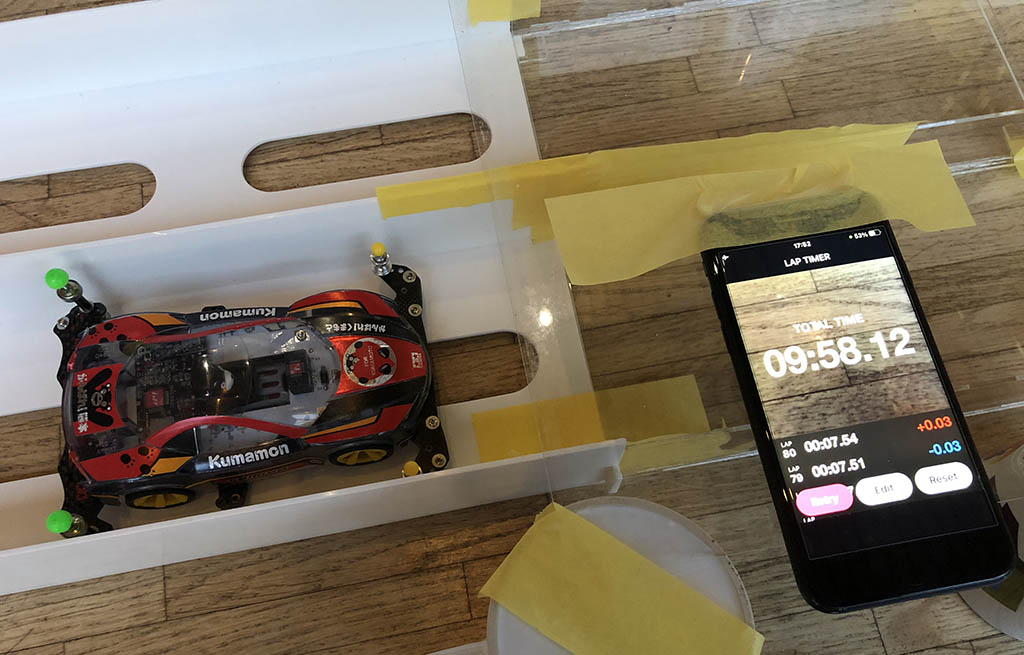
We used a standard 30cm ruler, a weight, some tape, a movie recorder that is able to capture video in slow motion (e.g. an iPhone X) and a tripod for smartphone.
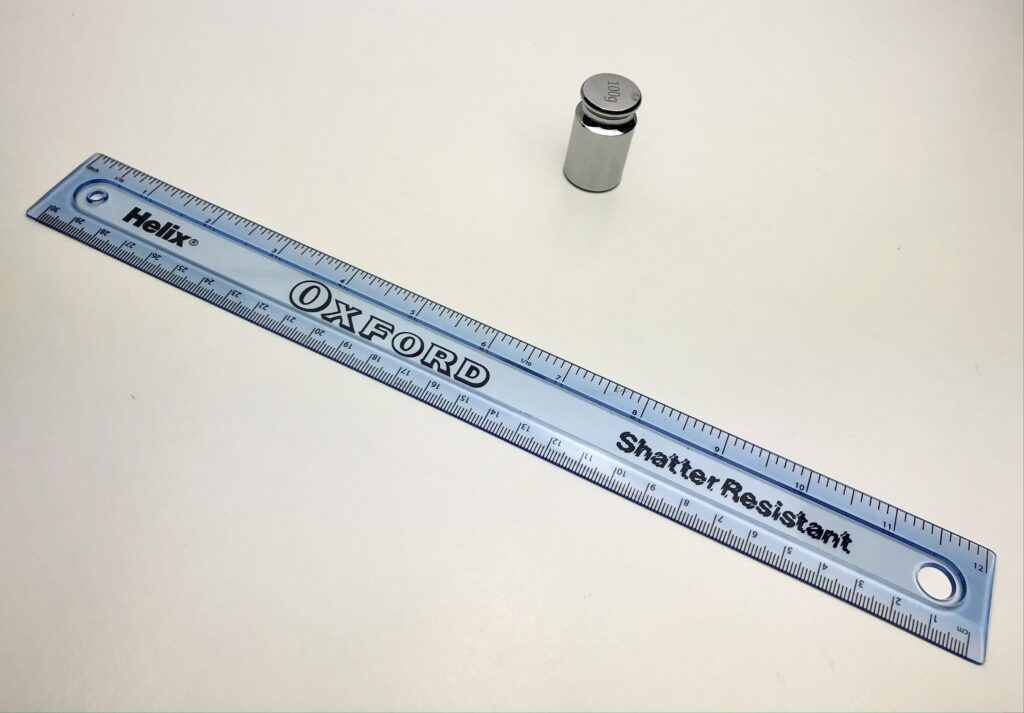
We taped the ruler to the weight so that we could stand the ruler up vertically. We used this to measure the drop height and the rebound height. Since the rebound happens so quickly for our eyes to see let alone take measurements, we mounted a high speed camera on the tripod to capture the moment of drop and rebound. We tried to point the camera towards the potential rebound height to reduce observation error. By watching the video replay in slow motion, we were able to observe the maximum rebound height.
The Tests
For the drop height, we levelled the bottom of the tyre to the 30cm mark on the ruler, this means the total height from the bottom of the tyre was 30.45cm (30cm + margin space on ruler).
To get a more accurate outcome, we only included results from good drops (i.e. those that bounded up almost vertically instead of going to the side) and ignored the bad drops. We repeated the drop many times in order to get at least 10 good results. Since we tested 7 different sets of tyres, we had to run this experiment more than 70 times!
After running 7 sets of experiments and recorded the bounce with a high speed camera, we watched the replay in slow motion. From the video, we were able to observe the maximum rebound height (top of the tyre). We moved the video frame by frame to find the maximum and ignored the bad drops. Once we found the maximum, we froze the frame, took a screenshot, took a measurement and noted down the value in a spreadsheet.
Once the experiment completed, we calculated the values, made some adjustments and plotted some charts.
Checks
We checked that the ruler is giving us the correct measurement by comparing it with another ruler.
We checked that the test surface is level and is clean.
Assumptions
We assume that the rebound on our worktop surface is very similar to the track surface.
We assume all four tyres in the set have the same bounce characteristics so there is no need to test all 4 of them.
Errors
Since we couldn’t guarantee that the tyres landed perfectly flat on the surface, there would be some variations in the bounce result. However running the experiment multiple times should help us mitigate the issue.
The Tyres (test candidates)
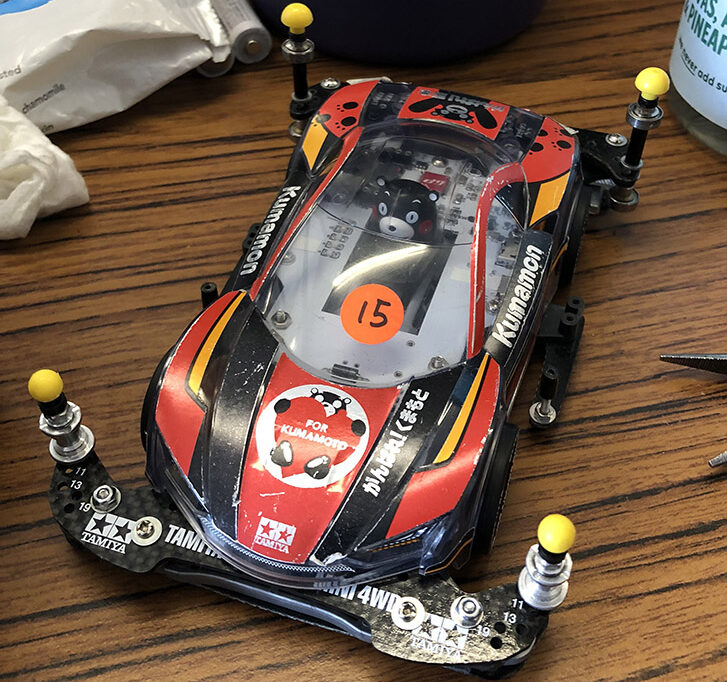
The car we will be using is our Mini 4WD PRO Series no.40 Raikiri (MA Chassis) Item No: 18640. The car weights around 160 grams with batteries, front and rear stays and rollers.
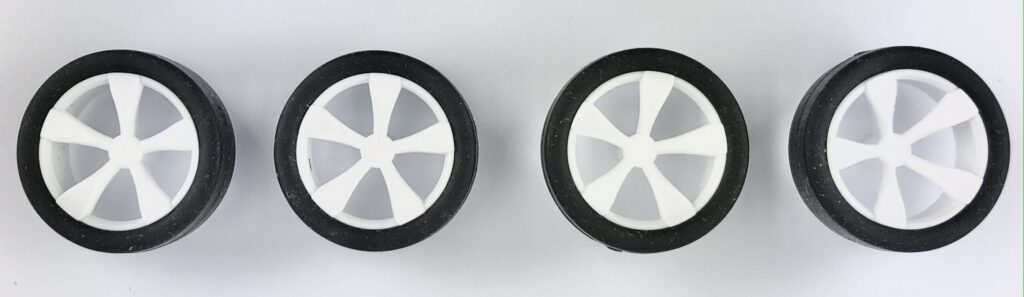
We will be testing seven sets of Tamiya Mini 4WD low profile small diameter tyres. Some are brand new and some are used. All tyres are secured to the wheel with Tamiya double sided tape [Item No: 10304] or equivalent.
Kit-standard from the box (white wheel with black tyres)
Low Friction Low Profile Tire (Maroon, 2pcs) [Item no: 95208] with kit standard white wheels
![Tamiya Mini 4WD low profile small diameter Low Friction Low Profile Tire (Maroon, 2pcs) [Item no: 95208] with kit standard white wheels](https://www.mini4science.com/wp-content/uploads/2024/09/IMG_0579-897x1024.jpg)
Low-Profile Offset Tread Tyres (Hard/Yellow) [Item no: 95205] with Raikiri wheels
![Tamiya Mini 4WD small diameter Low-Profile Offset Tread Tyres (Hard/Yellow) [Item no: 95205] with Raikiri wheels](https://www.mini4science.com/wp-content/uploads/2024/09/IMG_0581-882x1024.jpg)
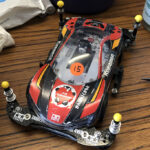
Super Hard Low-Profile Tire & Wheel Set (Spiral) J-CUP 2022 [Item no: 95152]
![Tamiya Mini 4WD low profile small diameter Super Hard Low-Profile Tire & Wheel Set (Spiral) J-CUP 2022 [Item no: 95152]](https://www.mini4science.com/wp-content/uploads/2024/09/IMG_0583-1024x859.jpg)
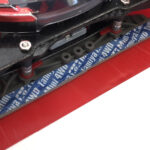
Super Hard Low-Profile Tire & Wheel Set (Spiral) J-CUP 2022 (used)
![Tamiya Mini 4WD low profile small diameter Super Hard Low-Profile Tire & Wheel Set (Spiral) J-CUP 2022 [Item no: 95152] (Used)](https://www.mini4science.com/wp-content/uploads/2024/09/IMG_0664-scaled-e1726181584290-1024x248.jpg)
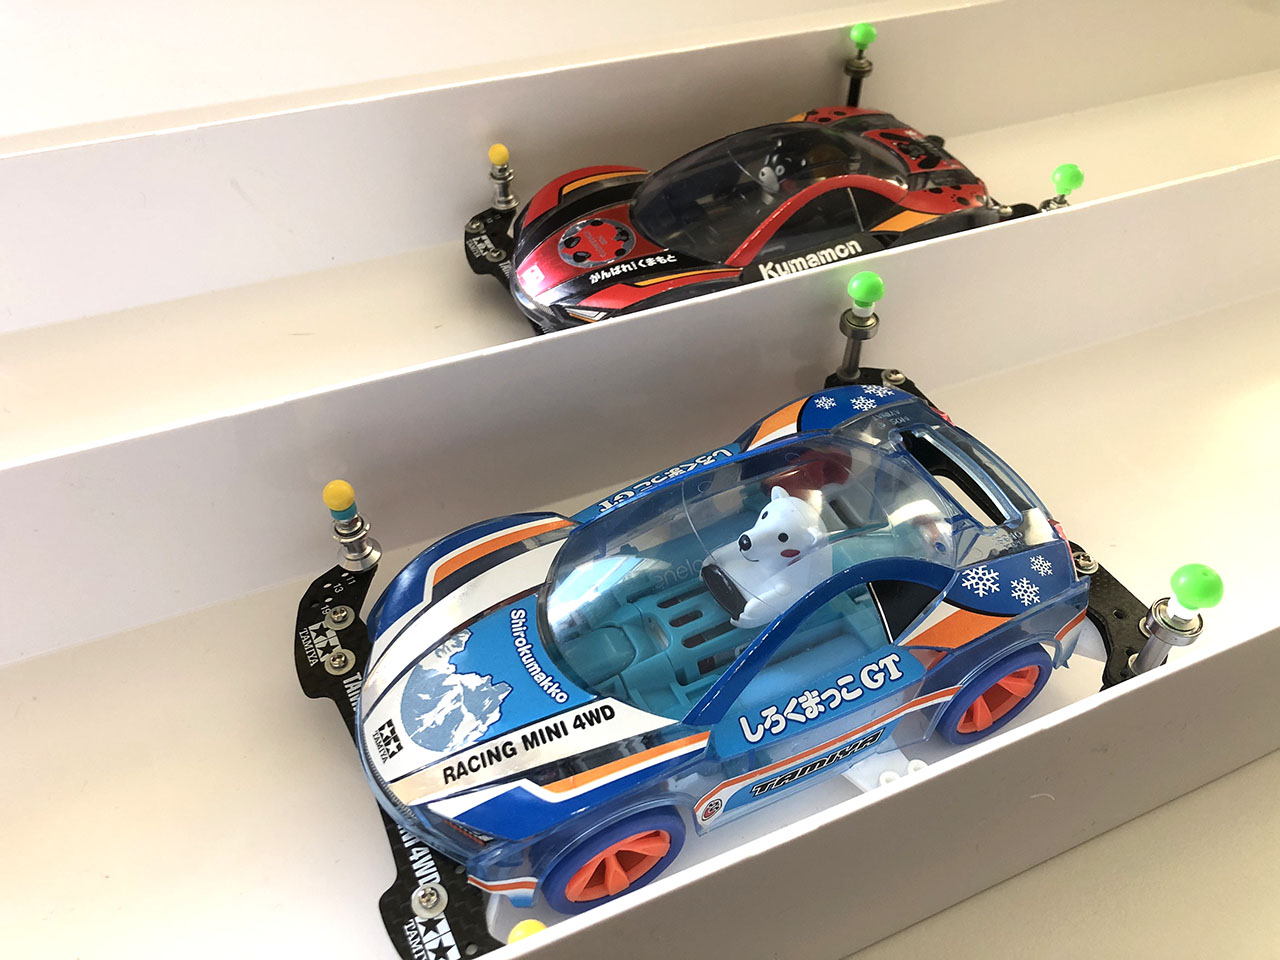
Kumamon GT – yellow wheel with black tyres (used) [Item no: 95281]
![Tamiya Mini 4WD low profile small diameter Kumamon GT yellow wheel with black tyres [Item no: 95281] (Used)](https://www.mini4science.com/wp-content/uploads/2024/09/IMG_0586-e1726181696426-1024x455.jpg)
Shirokumakko GT – orange wheel with blue tyres (used) [Item no: 95304]
![Tamiya Mini 4WD low profile small diameter Shirokumakko GT orange wheel with blue tyres [Item no: 95304] (Used)](https://www.mini4science.com/wp-content/uploads/2024/09/IMG_0585-e1726181748401-1024x455.jpg)
Test Results – Grip
Based on the measurements we captured in a spreadsheet, we calculated the Normal Force and the Pulling force and plotted the result below. We know the formula to calculate coefficient of friction (as above). We can use linear regression to help us find the best fit line, smooth out some errors and calculate coefficient of friction.
Since we assumed the rolling resistance (Fr) on pulley is zero, we could set the y intercept of the linear regression line to zero.
The gradient of the regression line is the friction coefficient.
To get the friction coefficient of each tyre, we would need to divide the value by 4. However in this experiment, we would present the value of the complete set instead since our Mini 4WDs needs to have four tyres.
We only show the verified friction co-efficient measurement of the 7 sets of tyres in this section. If you would like to see the detail experiment results and charts, please refer to Annex A – Tyres friction measurements below.
Now let’s put the experiment result together, plot the data in a bar chart and rank the tyres according to their friction coefficient.
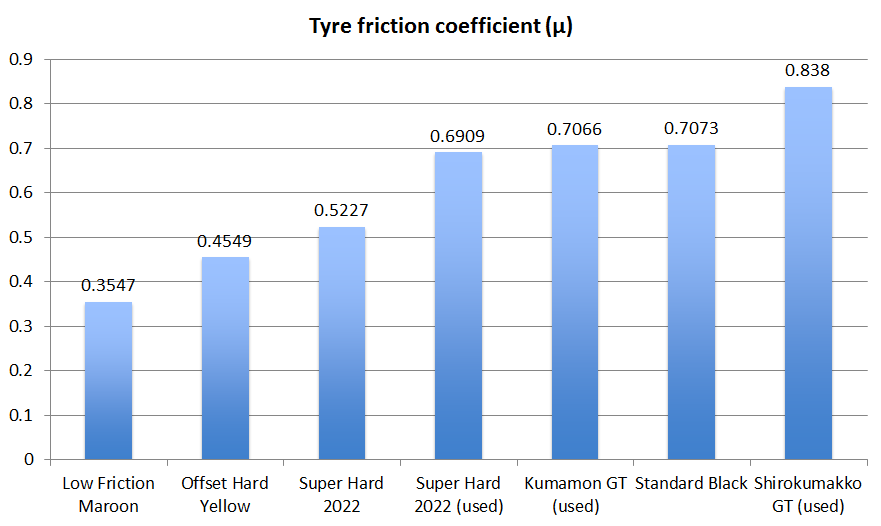
| Tyre | Friction coefficient (μ) |
| Low Friction Maroon | 0.3547 |
| Offset Hard Yellow | 0.4549 |
| Super Hard 2022 | 0.5227 |
| Super Hard 2022 (used) | 0.6909 |
| Kumamon GT (used) | 0.7066 |
| Standard Black | 0.7073 |
| Shirokumakko GT (used) | 0.838 |
A table showing friction coefficient of 7 sets of Tamiya Mini 4WD low profile small diameter tyres
From the experiment, our used Shirokumakko GT Tyres had the highest friction-coefficient hence the most grippy. Not surprisingly, our Low Friction Maroon Tyres have a lowest friction-coefficient as it says in the name.
Interestingly, we noticed that used tyres are generally more grippy than brand new ones. Perhaps they get softer after some use?
It is reassuring to see that standard tyres are more grippy than Super Hard Tyres, Offset Hard Tyres and Low Friction Maroon Tyres as this was what we believed. It is good to see that it has been confirmed with data.
Compare to Low Friction Maroon Tyres
If we take the Low Friction Maroon Tyres as a base, we can visualise how much more grippy the other tyres are in comparison.
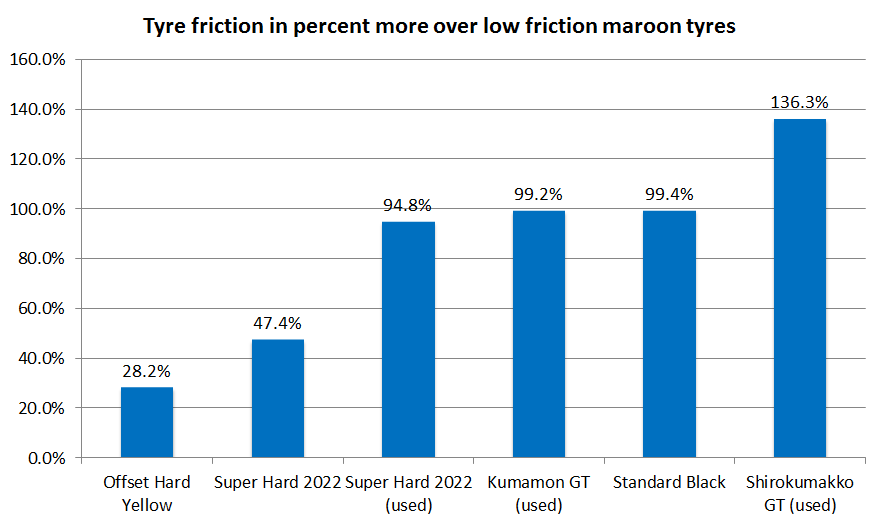
The Tamiya Mini 4WD kit-standard (Standard Black) Tyres were almost 100% more grippy than Low Friction Maroon Tyres. Whereas a brand new set of Super Hard Yyres were around 47% more grippy.
Used tyres were around 18% to 32% than brand new ones, with the exception of the Kumamon GT tyres. Perhaps they were not as used as the other tyres we have.
Test Results – Bounce
Based on the measurements we captured in a spreadsheet, we adjusted the bounce height values to reflect the distance the tyre travelled rather than just the measurement value we saw on the ruler. Now let’s plot the adjusted values in a chart and see what we can find.
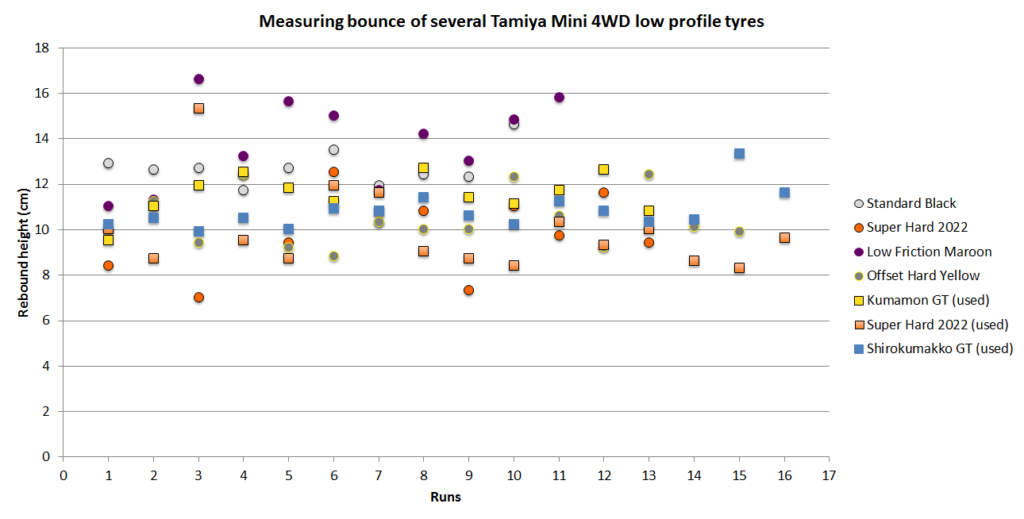
Our Low Friction Maroon Tyres and Super Hard 2022 seemed to have a bigger bounce variance than our Kit Standard Black Tyres.
Compare tyre bounce
Let’s use the values to calculate the average Coefficient of Restitution (Bounce rate) of each type of tyres, plot the data in some charts and rank the tyres according to their Coefficient of Restitution.
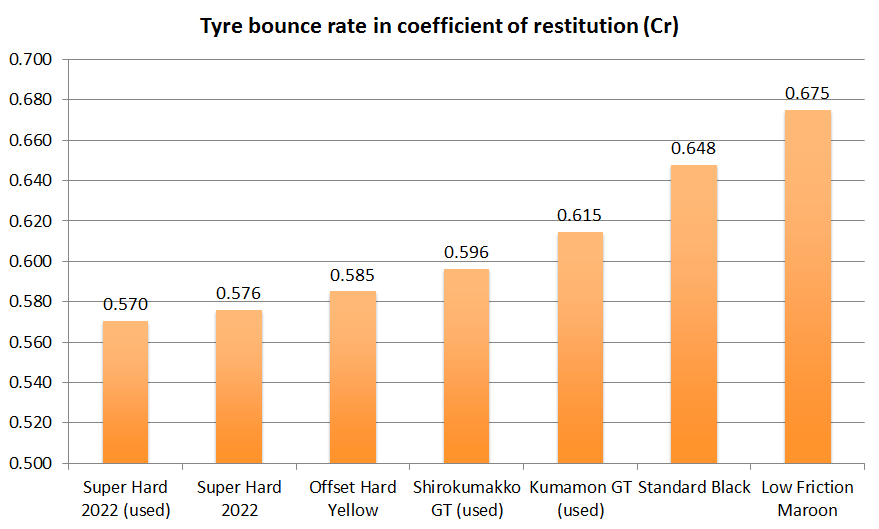
| Tyre | Coefficient of restitution (Cr) | +/- |
| Super Hard 2022 (used) | 0.570 | 0.20 |
| Super Hard 2022 | 0.576 | 0.16 |
| Offset Hard Yellow | 0.585 | 0.10 |
| Shirokumakko GT (used) | 0.596 | 0.09 |
| Kumamon GT (used) | 0.615 | 0.09 |
| Standard Black | 0.648 | 0.07 |
| Low Friction Maroon | 0.675 | 0.14 |
A table showing the average Coefficient of Restitution of the 7 sets of Tamiya Mini 4WD low profile small diameter tyres
From the experiment, our used Tamiya Mini 4WD Super Hard Low profile tyres 2022 had the lowest bounce rate, whereas our Low Friction Maroon Tyres had the highest bounce rate.
Used tyres seemed to have a lower bounce rate than brand new ones.
Looking at the bounce variance, tyres that came with the car kit seemed to have a more constant bounce than upgrade parts. Our Super Hard 2022 (used) had the biggest variance.
Compare to used super hard tyres
From the result, used Super Hard Tyres had the lowest bounce rate, so let’s use it as a base line and compare how much more bounce our other tyres had.
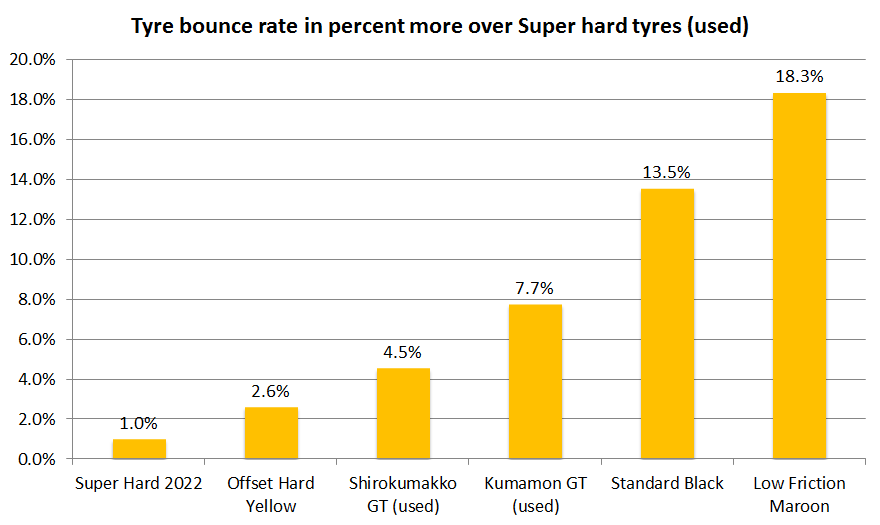
A new set of Super Hard Tyres were about 1% more bouncy than used one, which wasn’t that much. Low friction Maroon Tyres were around 18% more bouncy than Super Hard Tyres and Kit Standard Tyres were around 13.5% more. So if you swapped your kit standard tyres with a set of Low Friction Maroon Tyres, it would bounce more. But it you swapped them with Super Hard Tyres, it would bounce less.
It all nice and good to see all these numbers and comparisons, but what does it really mean on the track? How would my tyre selection affect the outcome of the race?
Putting into context
Let’s imagine a scenario where our Mini 4WD was about to jump down from the top of a slope jump to a straight section. The height of the drop is around 11cm.

Assuming our Mini 4WD landed perfectly flat with all four wheels touching the surface of the track at the same time; the bounce rate is the same on our desk as the track surface; the car wasn’t affected by any factors such as air friction etc… We can use our experiment result to estimate the height of the bounce.
The formula for calculating bounce is:
bounce height = ( Square root of drop height (11cm) * Co-efficient of Restitution )2
Here are the estimates of the bounce height for the 7 sets of tyres:
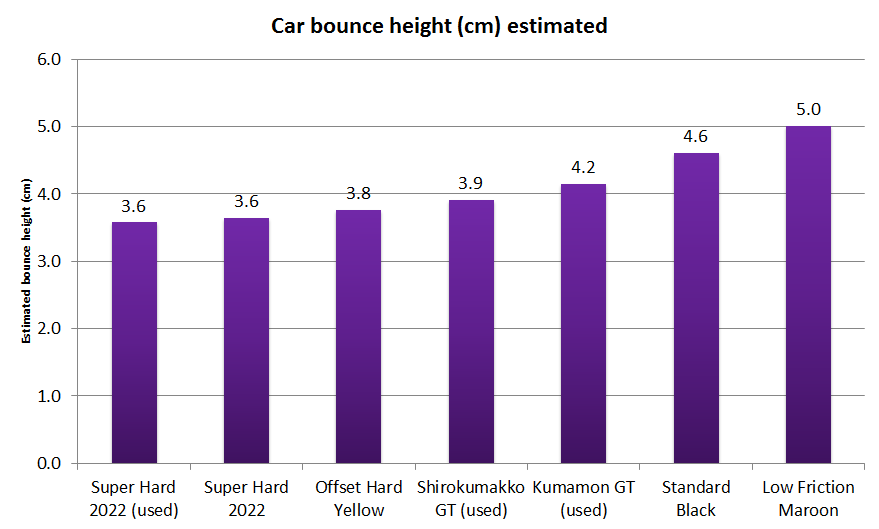
| Tyre | Car bounce height (cm) | +/- (cm) |
| Super Hard 2022 (used) | 3.6 | 2.2 |
| Super Hard 2022 | 3.6 | 1.7 |
| Offset Hard Yellow | 3.8 | 1.1 |
| Shirokumakko GT (used) | 3.9 | 1.0 |
| Kumamon GT (used) | 4.2 | 0.9 |
| Standard Black | 4.6 | 0.8 |
| Low Friction Maroon | 5.0 | 1.5 |
A table showing estimated bounce height after jumping off a slope section
The standard side wall height on a trace track is 5cm.
Let’s say we installed a set of Low Friction Maroon Tyres to our Mini 4WD, when the car bounced up after the jump, based on our estimates, the bottom of the tyres would be at the same height as the side wall of the track (i.e. 5cm). This meant there was a risk that the car could bounce off the track or got stuck on the side wall. In addition, there was a chance that it might bounce higher than 5cm.
With Standard Black Tyres, they would make the car bounce almost the same height as the wall (although not as high as our Low Friction Maroon Tyres). However the variance was smaller.
On the other hand, if we installed a set of Super Hard 2022 tyres, when the car bounced up after the jump, the bottom of the tyres would be below the top of the side wall as the bounce height should be ~3.6cm. Now we could rely on rollers or guards to keep the car in the lane.
Choosing the right tyres is really a matter of win or lose. But now, we can make a more informed decision. Let’s explore some more scenarios.
More speed
If the car went up the jump slope faster than 3 m/s, for example 5 m/s, it would have a peak height of more than 11cm (i.e. flying higher than the top of the slope).

Let’s say the peak height was 13 cm and we had Super Hard Tyres installed, the bounce height would be ~4.2cm, a higher bounce height than before. So the faster our Mini 4WD goes through the slope jump, the higher the bounce height.
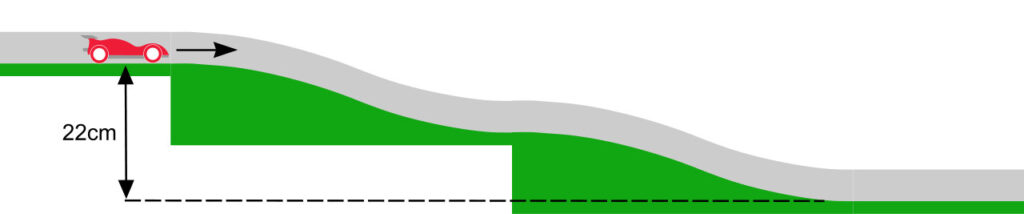
Higher jump
If we had to jump down a double slope that was 22cm high and our Mini 4WD managed to clear the slopes and landed on the flat, then the rebound height would be ~7.2cm with our Super Hard Tyres.
Test Results – combined
Let’s combine the tyre grip result with the tyre bounce result and look at the two together in a single chart.
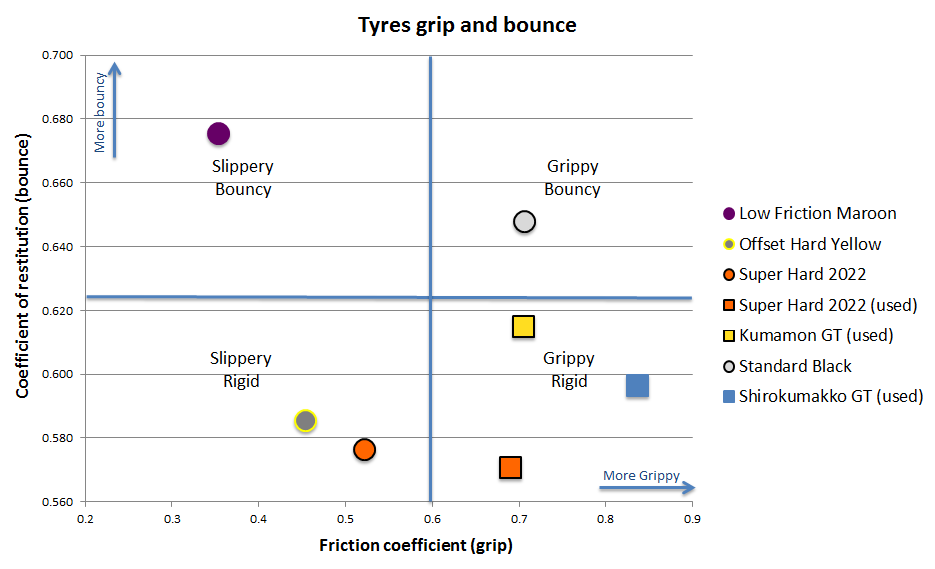
Based on the chart, if we wanted a tyre with the least bounce and some good grip, then a set of used Super Hard Tyres seemed to be a good choice. If we wanted a tyre with less grip and less bounce, then Offset hard yellow seemed to be a good choice.
The most slippery tyres were our Low Friction Maroon Tyres, but it had the highest bounce which could be a problem in a technical track with lots of jumps.
What does the result mean to fellow racers?
Choosing the right set of tyres is key to achieving good result. Racers have to get the right combination of tyre grip and bounce to win races.
Grip
Grip is a bit of a double edge sword, tyres with good grip is great for acceleration, but bad for cornering (the friction that helps accelerating is also bad for changing direction). On the other hand, tyres with less grip is great for corning, but bad for acceleration. From our experiments, we have found that Low Friction Maroon Tyres have the least grip whereas kit standard tyres have the most.
Some racers try to get the best of both worlds by using lower grip tyres in front and higher grip tyres at the back. Tyre combination is beyond the scope of this experiment, but we could look into this in future experiments.
Certainly the condition of your tyres will affect grip, but don’t forget the track surface will have an effect on grip too. It could be different material e.g. the ABS plastic surface of a Tamiya Junior Circuit or the special surface of a Tamiya five lanes wooden track. Furthermore, the condition of the track surface will also play a role such has smooth or scratched, clean or dusty and dry or damp (from humidity) etc… will also affect the grip of the tyres.
In this experiment, we only tested our tyres on smooth clean Tamiya Junior Circuit surface, so we can’t provide the friction coefficient value for different surfaces, however, being all things equal, the ranking of the tyres by grip should still hold.
Bounce
As for bounce, certainly all racers would want tyres with the lease bounce to reduce the risk of course out. However different tyres have different bounce rate. Low Friction Maroon Tyres although would help cornering speed, it has the highest bounce rate. For racers who are looking for tyres with lower bounce rate, Super Hard Tyres and Offset Tyres would be a good choice.
Similar to the case with grip, the track material and the floor material will affect the bounce rate of the tyres. We only tested our tyres on a solid wood workshop desk, so we can’t provide bounce rate value (coefficient of restitution) for different tracks. However, the ranking of the tyres by bounce rate should still hold.
Unexpected Discovery
An interesting discovery is that, from our set of tyres, used tyres seemed to have more grip and less bounce than a brand new set. Perhaps it is worth using old tyres?
Conclusion
We set out to measure the grip and bounce rate of 7 sets of Tamiya Mini 4WD low profile small diameter Tyres so that we can make an informed decision when choosing tyres. We achieved just that. We found that Low Friction Maroon Tyres had the least grip whereas Kit Standard Tyres had the most. As for bounce, we found that that Super Hard Tyres had the least bounce, with Offset Tyres as the close second, whereas Low Friction Maroon Tyres had the most bounce. In addition, we made an interesting discovery that used tyres seemed to have more grip and less bounce than a brand new set.
The experiment we did is by no means conclusive. We have yet to test more tyres to get a more accurate measurement average. Your equipment and your experiment might produce slightly different results. However the investigation does give an insight to the performance of different small diameter low profile tyres. We hope that it provides you a useful insight to the subject matter.
What would you take away from this experiment? How would you improve it? Would you repeat the experiment on your tyres? Please feel free to leave a comment on our Facebook page @Mini4Science or through our contact us page.
Annex A – Tyres friction measurements
Charts showing the normal force and pulling force of 7 sets of tyres. The R2 values are over 0.95 meaning there is a statistically significant relationship between Normal force and Pulling force.
Standard Black Tyres
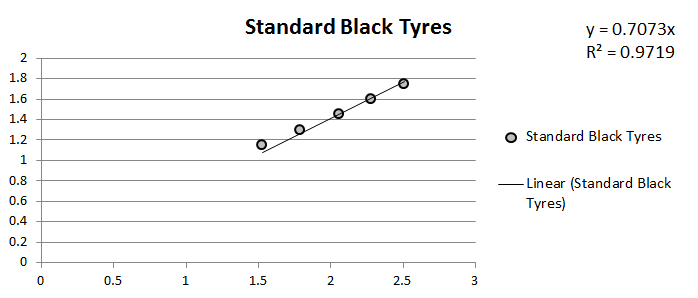
Coefficient of friction of the set of tyres (Average): 0.713380872
Standard Deviation: 0.022472112
Coefficient of friction of the set of tyres (Regression): 0.7073
Coefficient of friction per tyre (from Regression): 0.176825
Used Kumamon GT Tyres
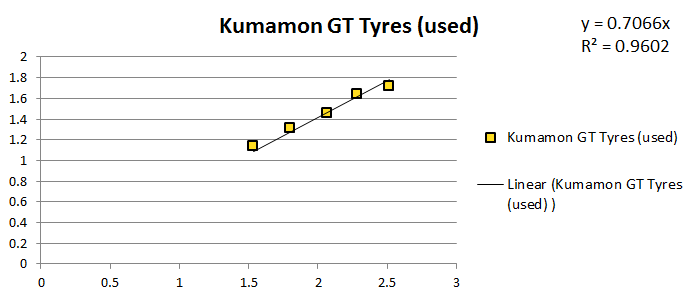
Coefficient of friction of the set of tyres (Average): 0.712662097
Standard Deviation: 0.023339518
Coefficient of friction of the set of tyres (Regression): 0.7066
Coefficient of friction per tyre (from Regression): 0.17665
Used Shirokumakko GT Tyres
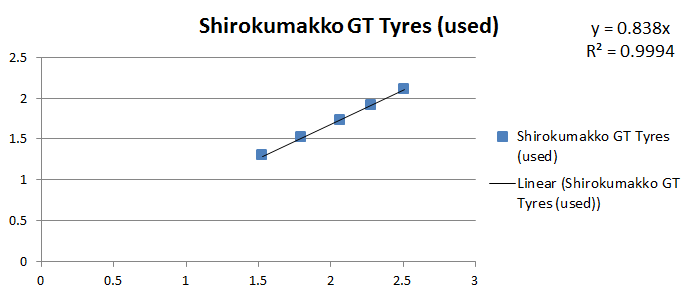
Coefficient of friction of the set of tyres (Average): 0.839119486
Standard Deviation: 0.004205247
Coefficient of friction of the set of tyres (Regression): 0.838
Coefficient of friction per tyre (from Regression): 0.2095
Low Friction Maroon Tyres
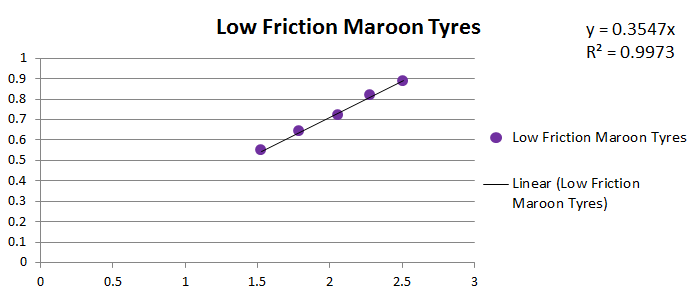
Coefficient of friction of the set of tyres (Average): 0.355001451
Standard Deviation: 0.003486009
Coefficient of friction of the set of tyres (Regression): 0.3547
Coefficient of friction per tyre (from Regression): 0.088675
Offset Hard Yellow Tyres
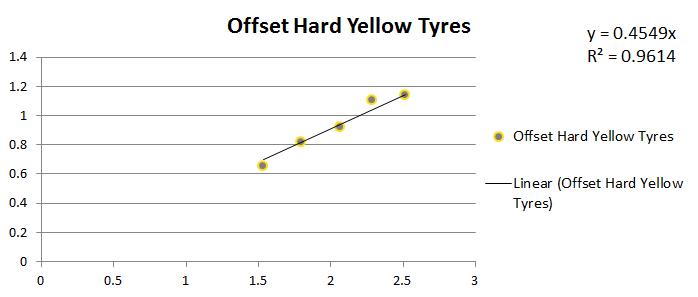
Coefficient of friction of the set of tyres (Average): 0.451337497
Standard Deviation: 0.020055061
Coefficient of friction of the set of tyres (Regression): 0.4549
Coefficient of friction per tyre (from Regression): 0.113725
Super Hard 2022 JCUP Tyres
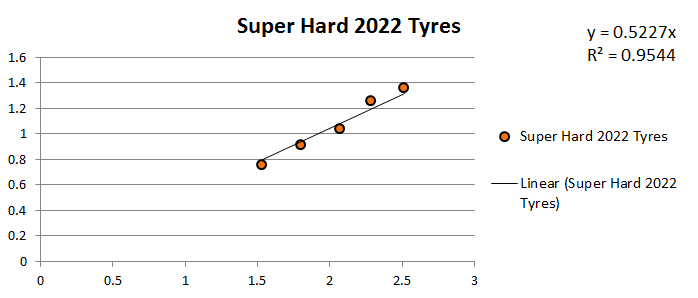
Coefficient of friction of the set of tyres (Average): 0.516315067
Standard Deviation: 0.025653127
Coefficient of friction of the set of tyres (Regression): 0.5227
Coefficient of friction per tyre (from Regression): 0.130675
Used Super Hard JCUP 2022 Tyres
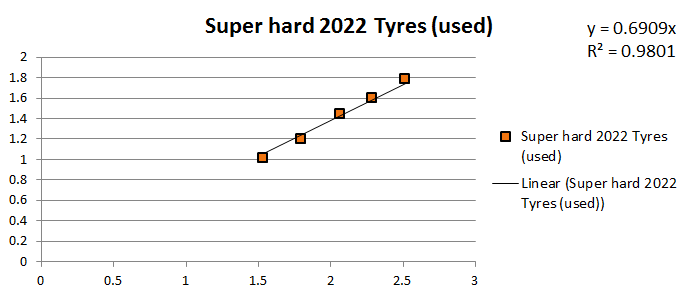
Coefficient of friction of the set of tyres (Average): 0.684533037
Standard Deviation: 0.022933244
Coefficient of friction of the set of tyres (Regression): 0.6909
Coefficient of friction per tyre (from Regression): 0.172725
![8 different Tamiya Mini 4WD metal rollers [Item no: 95612, 15522, 95643, 95497, 15426, 95160, 15345, 15475]](https://mini4science.com/wp-content/uploads/2024/07/IMG_0296-150x150.jpg)


![8 different Tamiya Mini 4WD metal rollers [Item no: 95612, 15522, 95643, 95497, 15426, 95160, 15345, 15475]](https://mini4science.com/wp-content/uploads/2024/07/IMG_0296-scaled.jpg)