How much horsepower does a Tamiya Mini 4WD Hyper-Dash PRO motor generate? How much torque does it have? Where is the sweet power band of the motor? Let’s do some experiments to find out.
Introduction
We have been testing different Tamiya Mini 4WD PRO motors performance for quite some time now and we have even conducted experiments to find out the best matching gear ratios for different motors. However, two questions that we have been longing to find an answer is that
- Can we get a decently accurate power (horsepower) and torque curve of a Tamiya Mini 4WD motor such as the popular Hyper-Dash PRO?
- Where is the sweet power band of the motor?
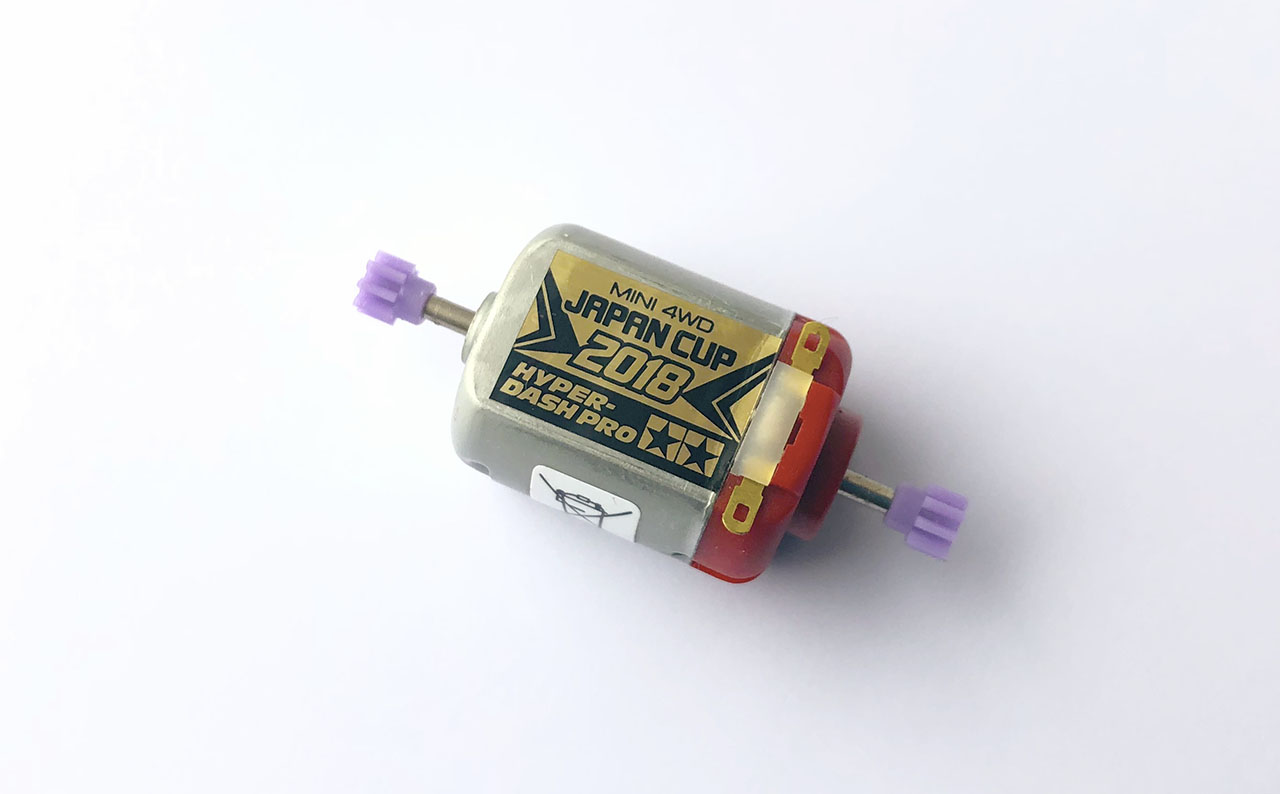
From the back of the packaging, we can see that the Tamiya Mini 4WD Hyper-Dash PRO motor has an RPM range of 17,200 to 21,200 and recommended torque load between 1.4 – 1.9mNm. (Note: mNm means milli–Newton metre)
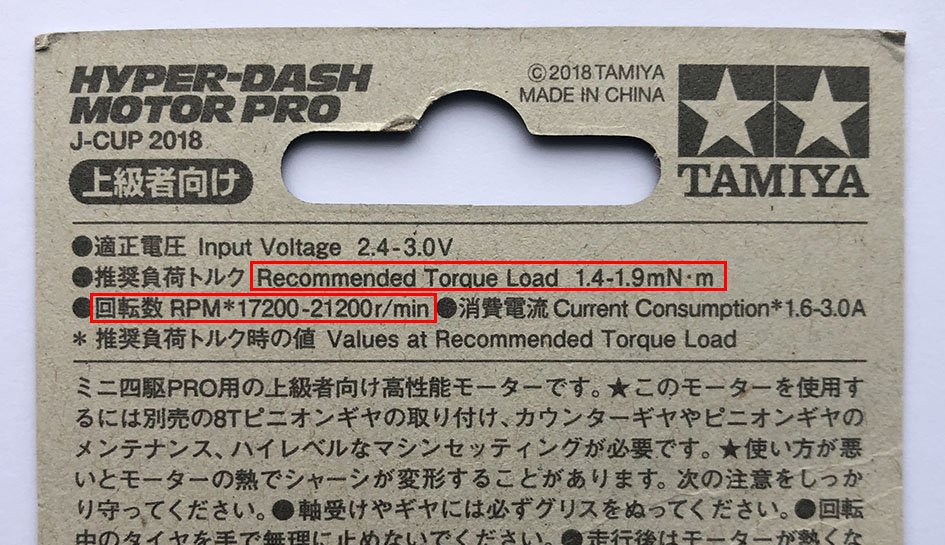
But it does not give us any information about power and torque curve. So we set out to do some experiments to find out.
Hypothesis
We expect the power and torque follow this pattern. We get the maximum torque at low RPM and the torque decreases as the motor reach maximum RPM. We get maximum power at the middle of the RPM range. Let’s see whether our Hyper-Dash PRO follows this performance pattern.
Chart Source: https://evmc2.wordpress.com/2014/07/21/electric-motor-power-really-simple-and-hp-ratings/
Test equipment
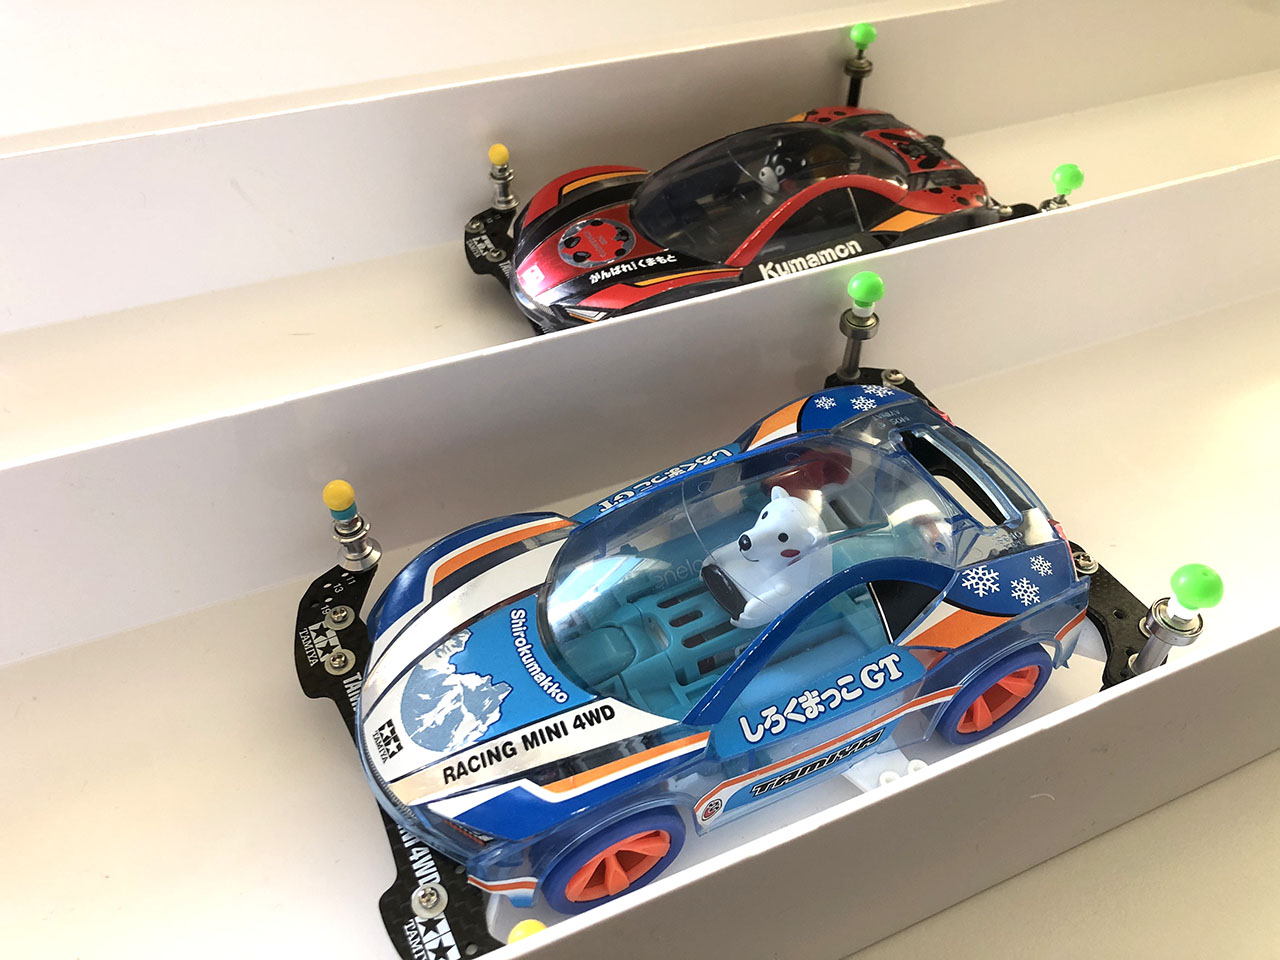
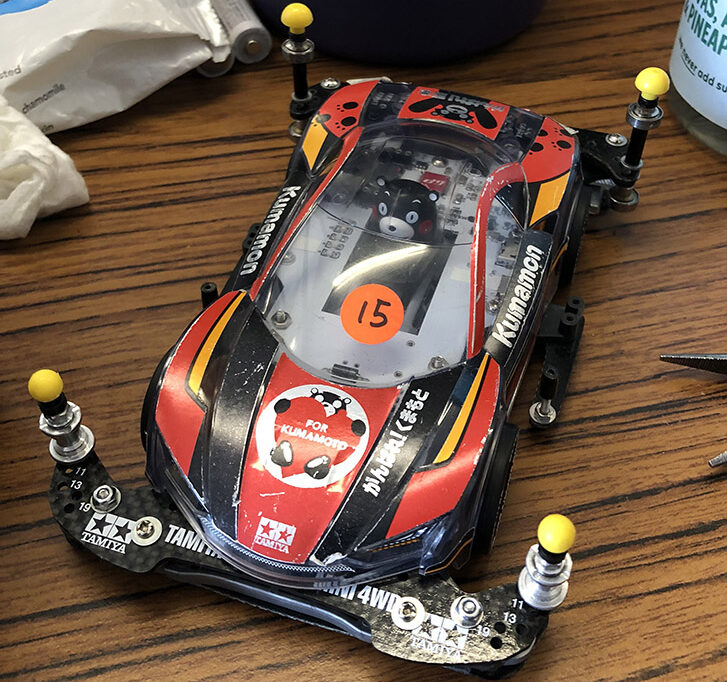
Car: Our Mini 4WD Mark 7 Development Prototype based on Shirokumakko GT (95304) car. For more information please refer to our Mini 4WD page.
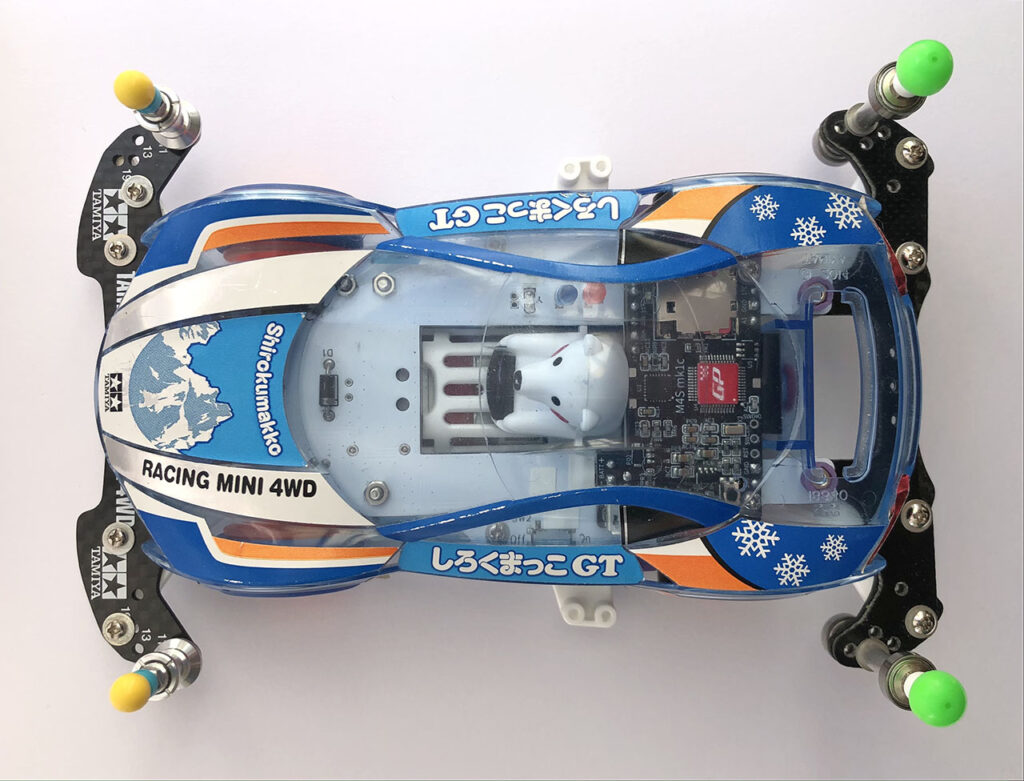
Chassis: MA Chassis
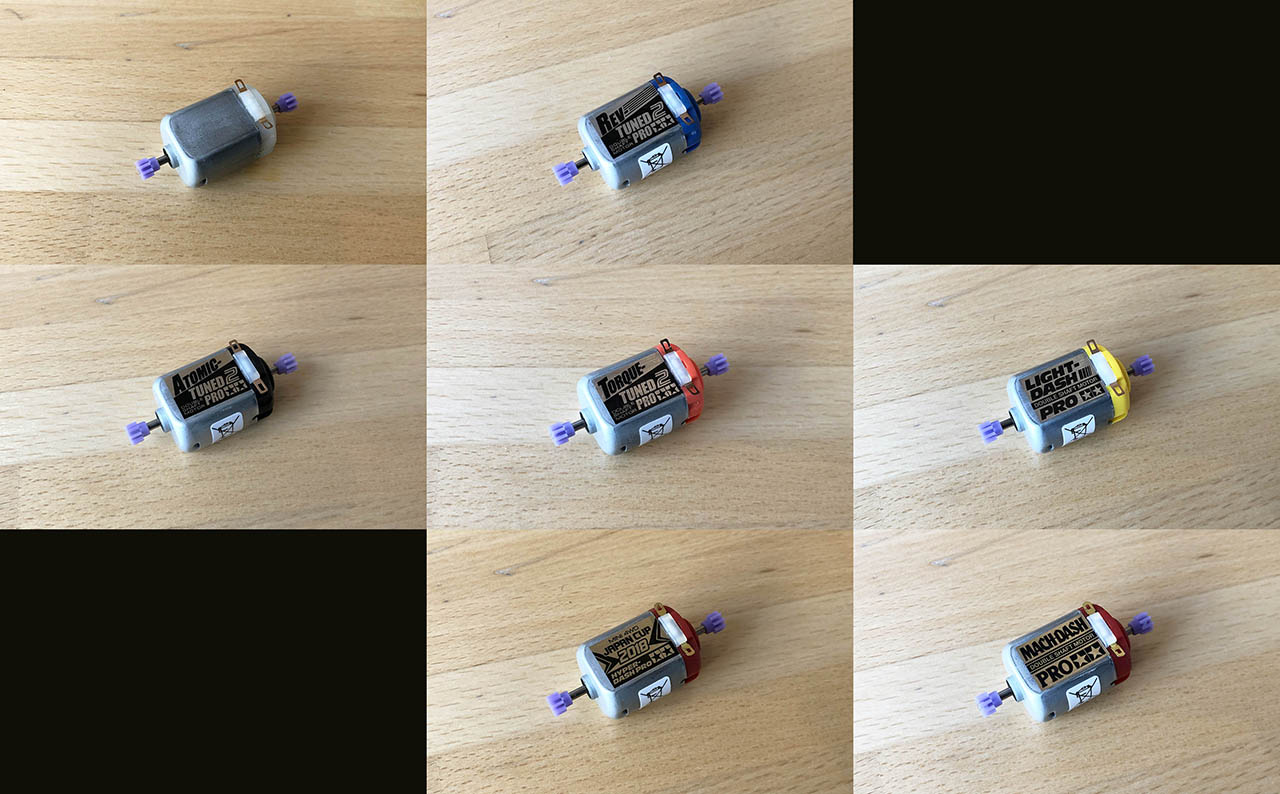
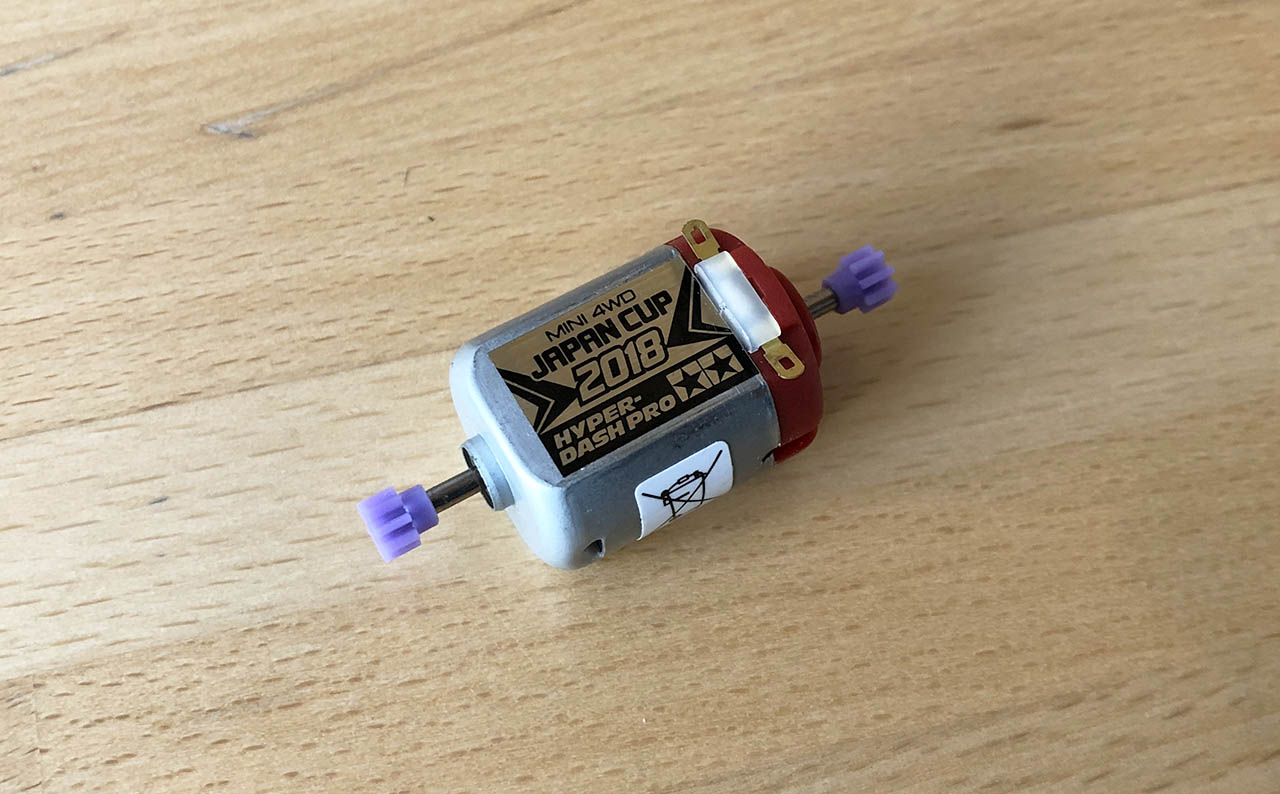
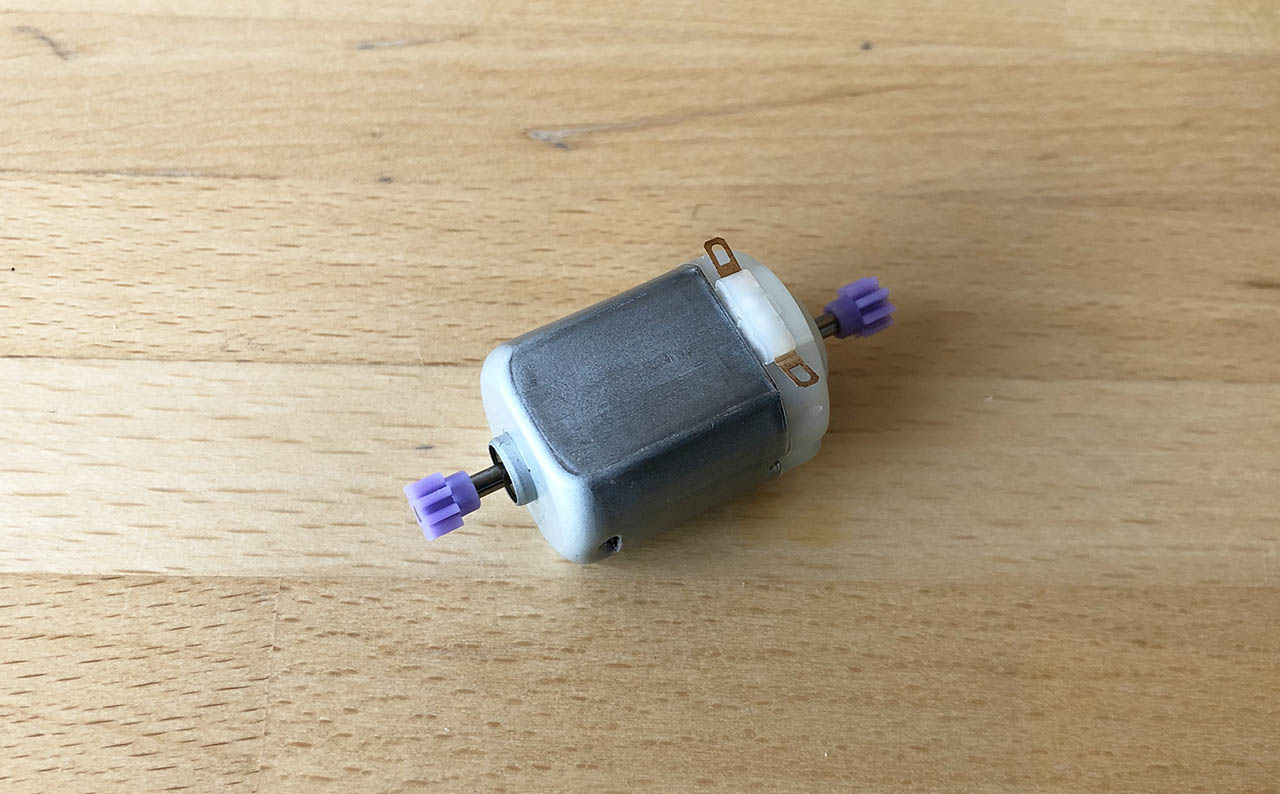
Motor: Tamiya Mini 4WD Hyper-Dash PRO 2020
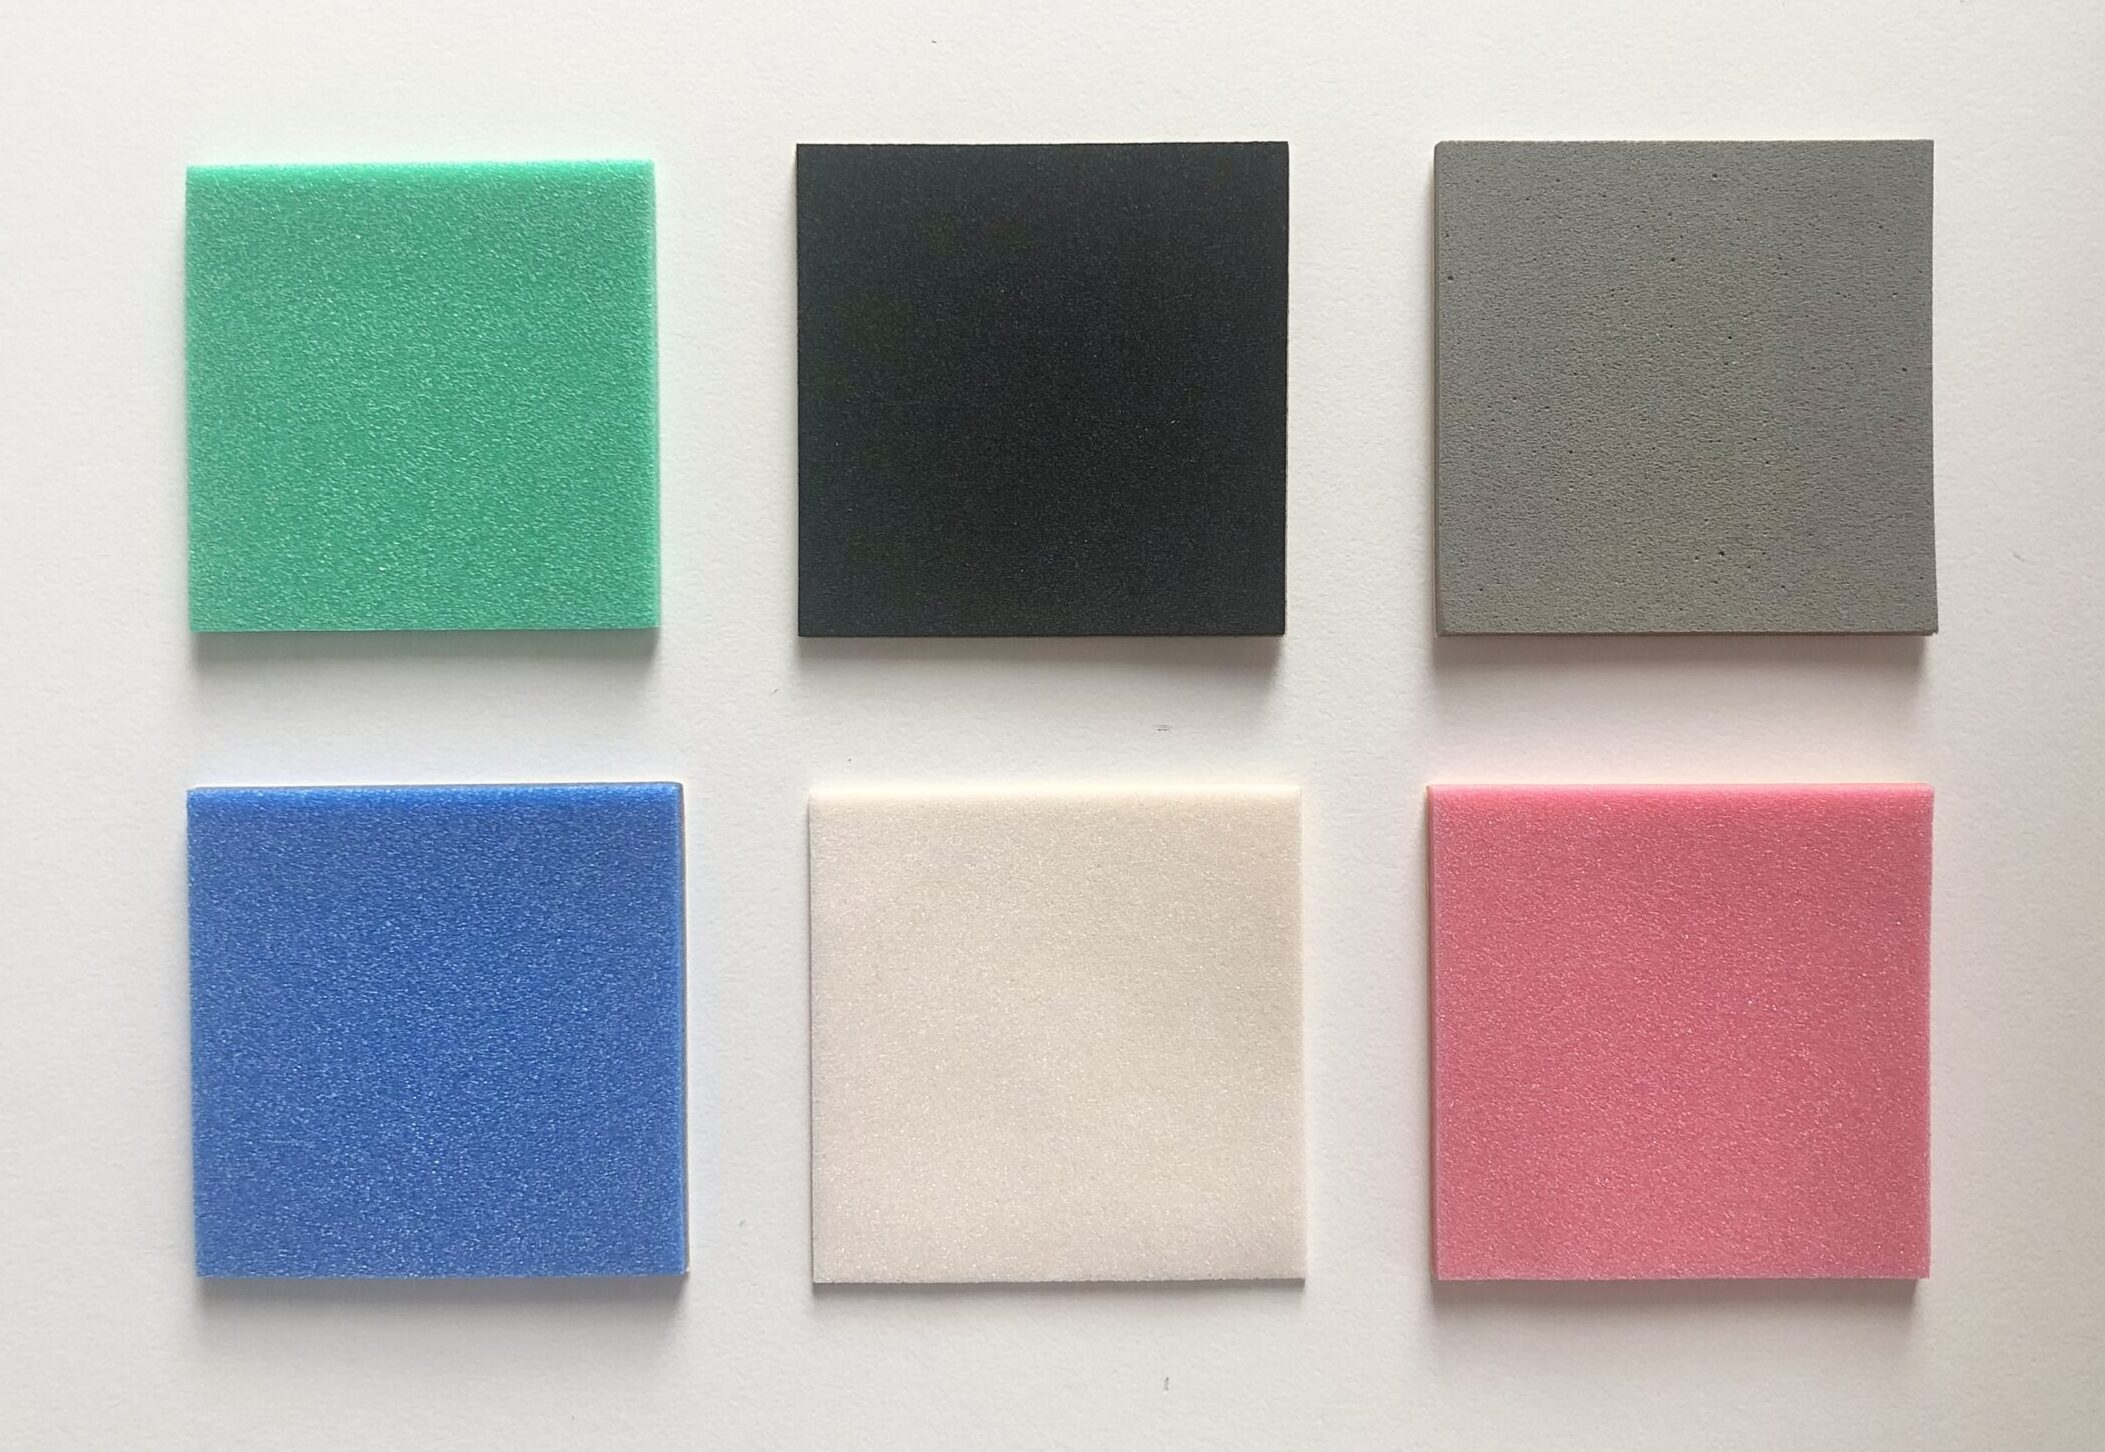
Gear Ratio: 3.5:1 (green and pink)
Wheel Diameter including tyres: 2.61 cm
Battery: Eneloop AA Light 950mAh batteries (blue)
Mass: 189 grams
Telematics:
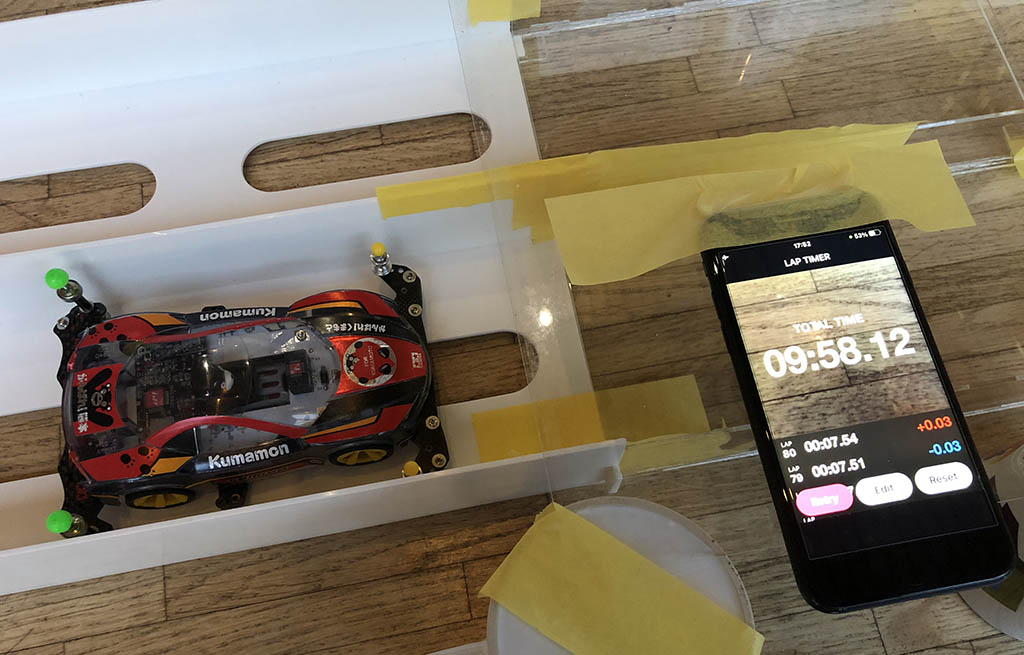
Custom built computer M4S Mk1c to run the measuring program and to record data. It contains a Atmel ATSAMD21 Cortex M0 48Mhz processor (Arduino Zero) as the main processor, 6-axis gyroscope and accelerometer (MPU6050) to measure acceleration and rotation, a 32GB MicroSD Card to record data, a quartz crystal to help measure time accurately and a tachometer to measure distance.
Test method
During our recent social event, we had the opportunity to run our Mini 4WD AI cars many times on the race circuit. This gave us the perfect opportunity to collect tonnes of valuable running data and to improve and optimise the AI algorithm. Part of the data set was about speed and acceleration from launch. We had 12 runs worth of data with the same car setup. This is plentiful for what we need. Although sometimes the batteries were not fully charge when we did the test runs, they were close to full. So the test condition should be good enough for what we need. We can use these data to help us identify the power and torque of the motor.
Here is a diagram of the race circuit that was used for the experiment (see below). The car was launched from the starting line (inner lane / blue start lane), going through a long straight section (highlighted in purple). The length of the straight is around 3.38 metres long.
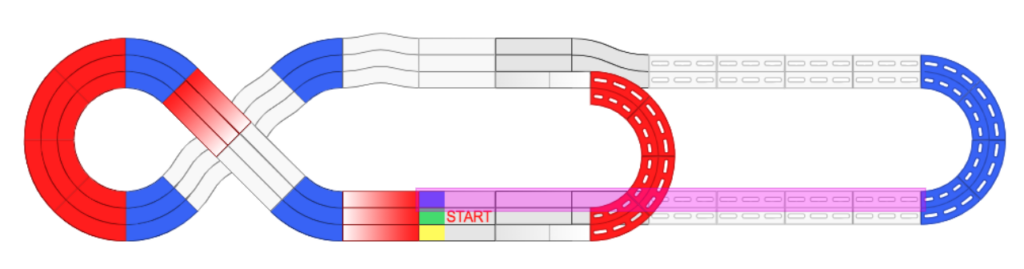
We used push start as the launch mode.
The on-board computer measured distance, time and other information every 10 milliseconds (0.01 seconds or 100 times a second) and stored the data in the on-board Micro SD card in a CSV file format. After every run, we download the data to my laptop. We can derive speed and acceleration based on the data collected. We used a combination of our analytical tools and spreadsheet software to help us analyse the results, calculate performance figures, generate some nice charts and derive power and torque curves.
Calibration
The tachometer and the clock are based on previous calibration.
Considerations
Physical resistive forces such as air friction, mechanical friction (gears and drive train) and tyre friction can affect the outcome. The electrical resistance in the power control circuit might affect the acceleration although the resistance value is miniscule (less than an ohm). The condition of my batteries e.g. charged voltage and internal resistance and motor condition e.g. run-in or worn out can also affect the outcome. Tyre skid is an issue as the tachometer will read the wheel turning motion even the car might not be moving as fast. We could cross check the acceleration figures with the accelerometer measurements.
Results
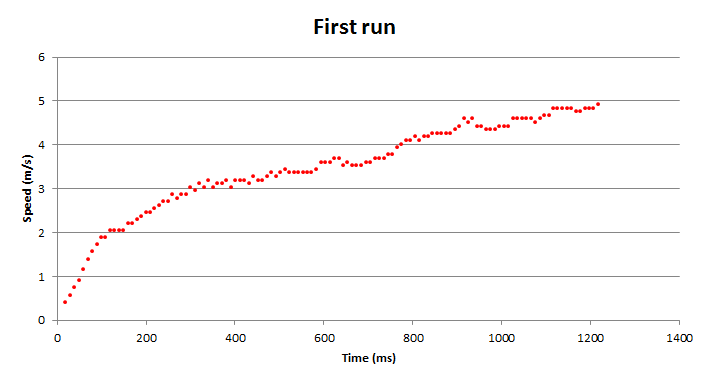
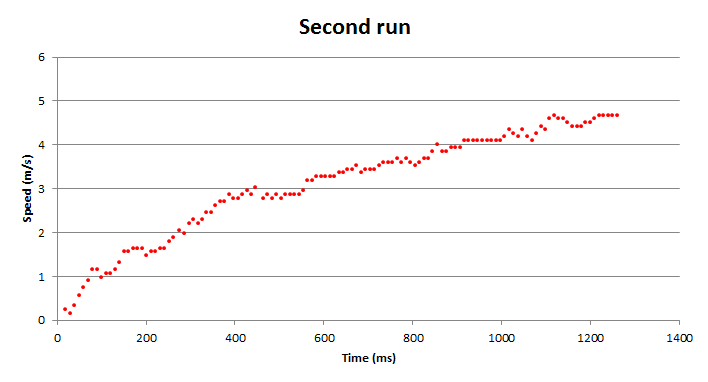
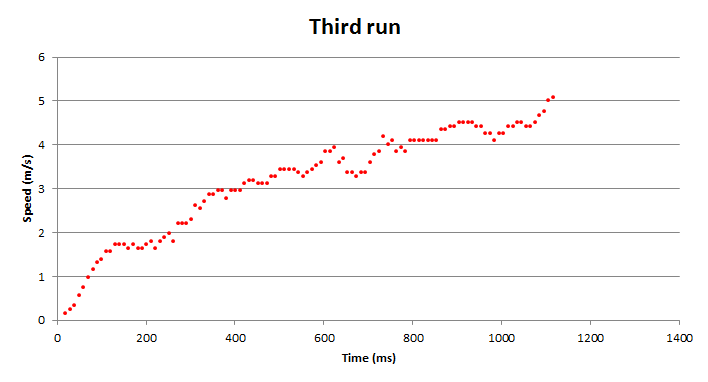
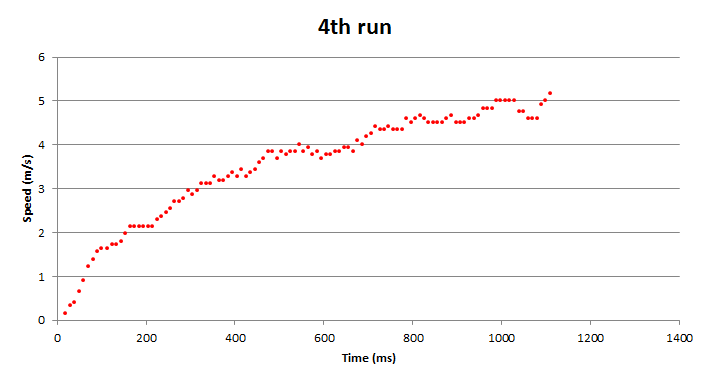
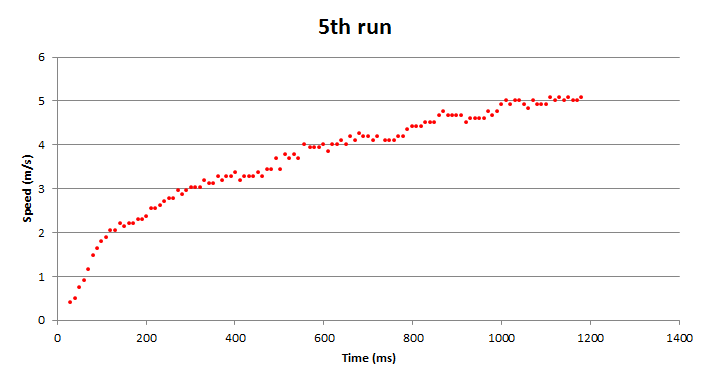
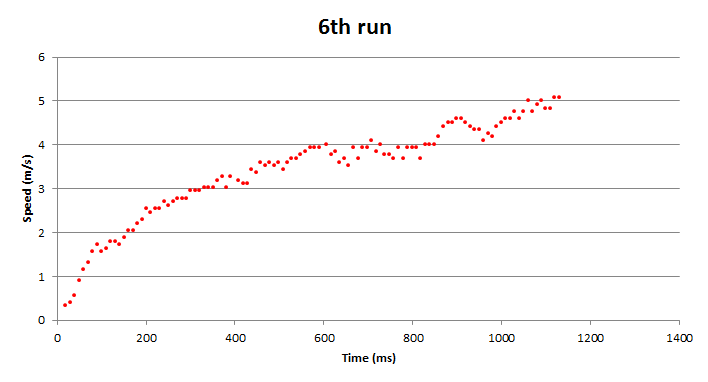
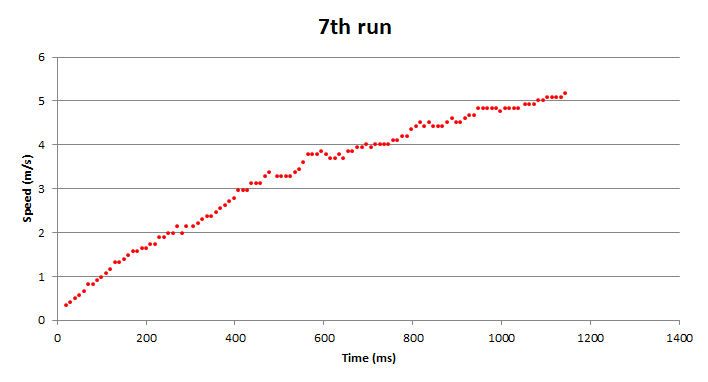
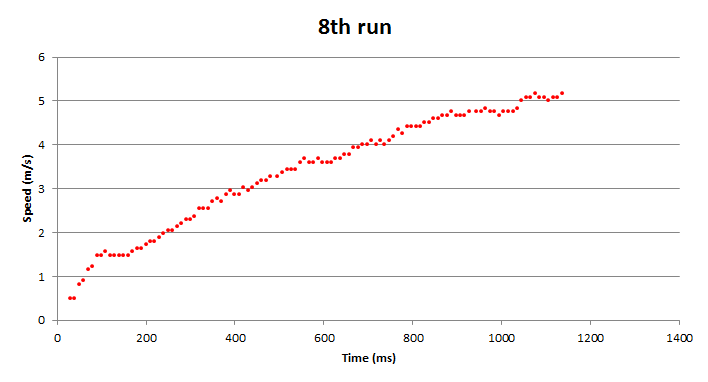
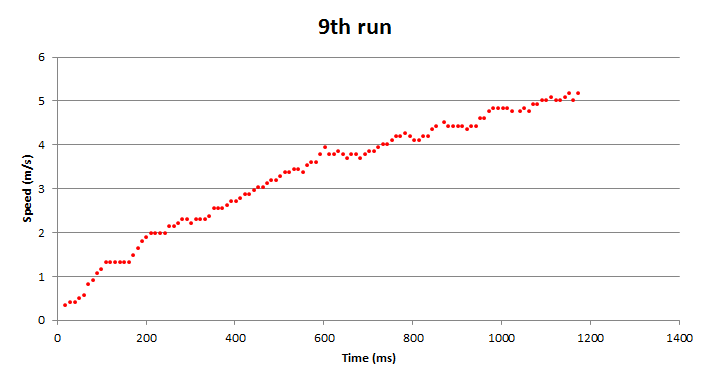
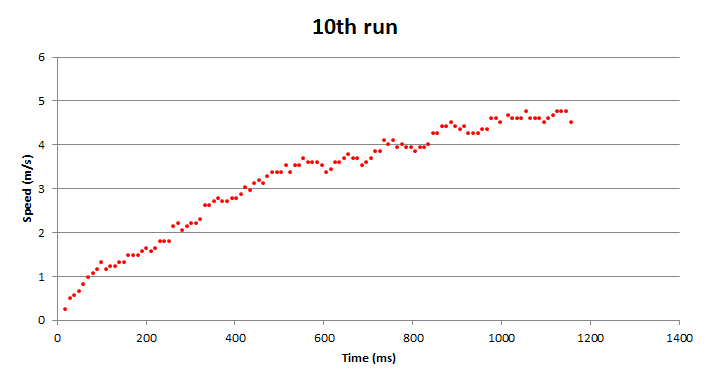
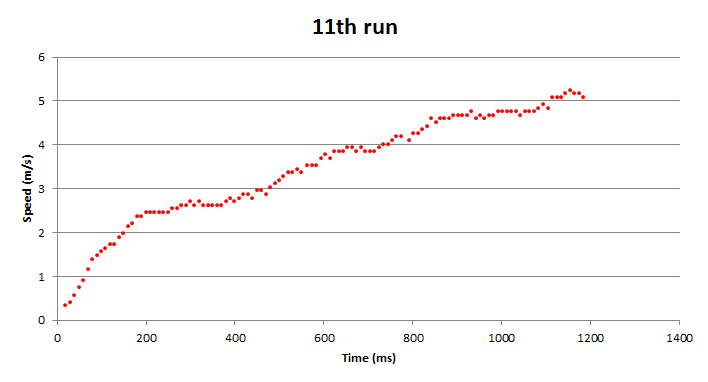
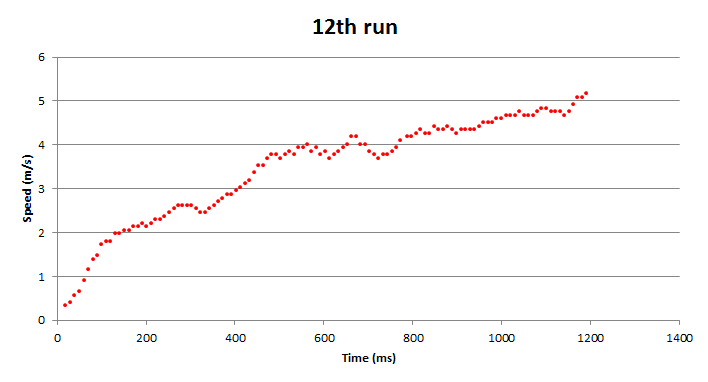
Here is a chart based on the data collected. They are the result after 12 runs. We plotted each run on a chart with speed ion metre per second on the vertical axis and time in milliseconds on the horizontal axis. We placed all 12 charts in a tile grid to make it easier for us to spot any interesting patterns. For more information about each run, please refer to the Annex A at the bottom of this article.
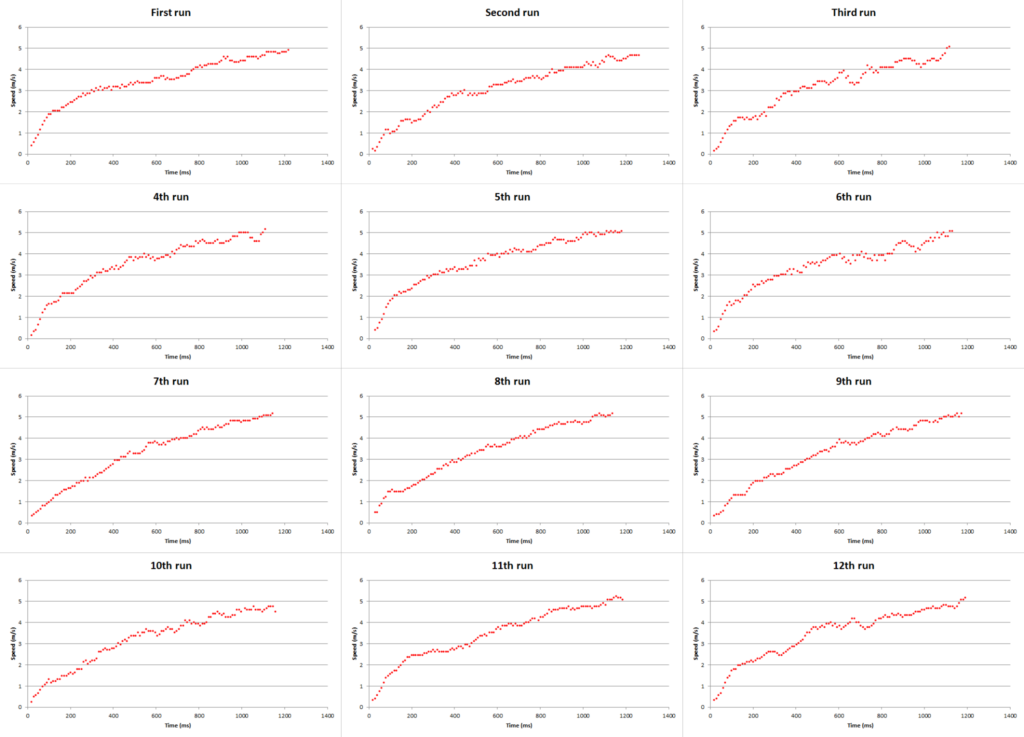
Looking at the charts, it seems like the motor pushed the car the strongest from standstill and the acceleration decreased as the speed built up until it gradually flattens. The pattern is more like a curve other than a straight line.
We can see some spikes and drops in the charts. Some are more than others. Perhaps these were due to a combination of tyre skid effect and measurement error.
Analysis
Putting the 12 charts on top of each other
Let’s plot all 12 runs into one single chart with speed in metre per second over time in milliseconds and use different colours and markers to show the data points.
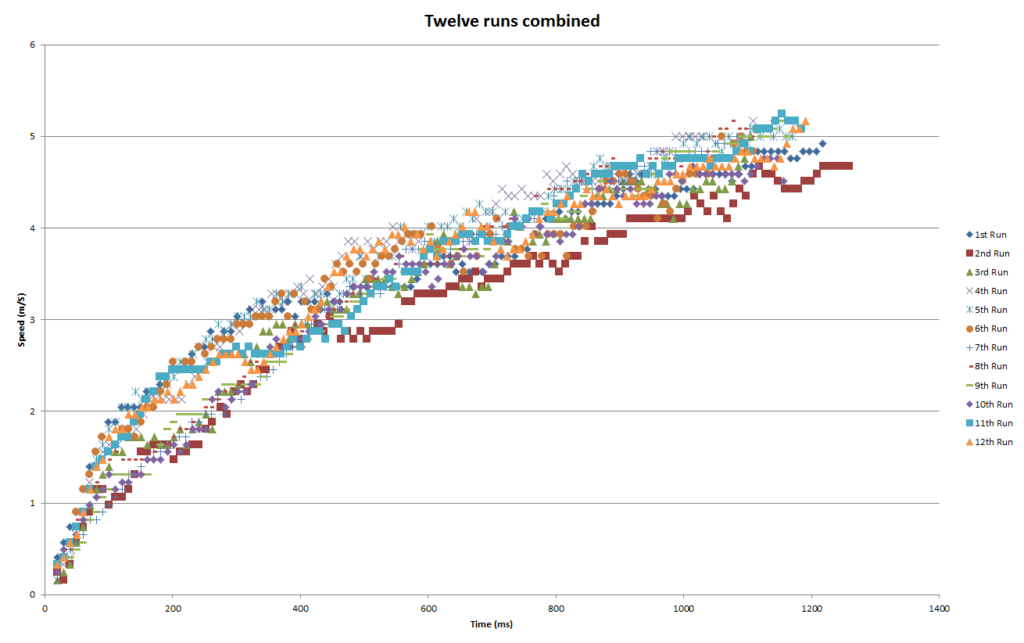
The results from the 12 runs are pretty close to each other. Overall the pattern is similar to what we see in previous test results.
When we put all the data together, we can see that the data points from different runs are quite close to each other. Some runs are faster and some are slower. Some might be caused by the fact that we didn’t fully charge the batteries before each run and some might cause by performance volatility of the batteries and motor (as seen in previous experiments). But all in all, the data is good enough to derive a speed curve.
Finding the speed curve
To find the speed curve, we put all data into a single series and plot a chart with speed (m/s) over time (seconds). But this time we converted time from milliseconds to seconds. We can now use regression to help us work out the speed curve based on the data collected.
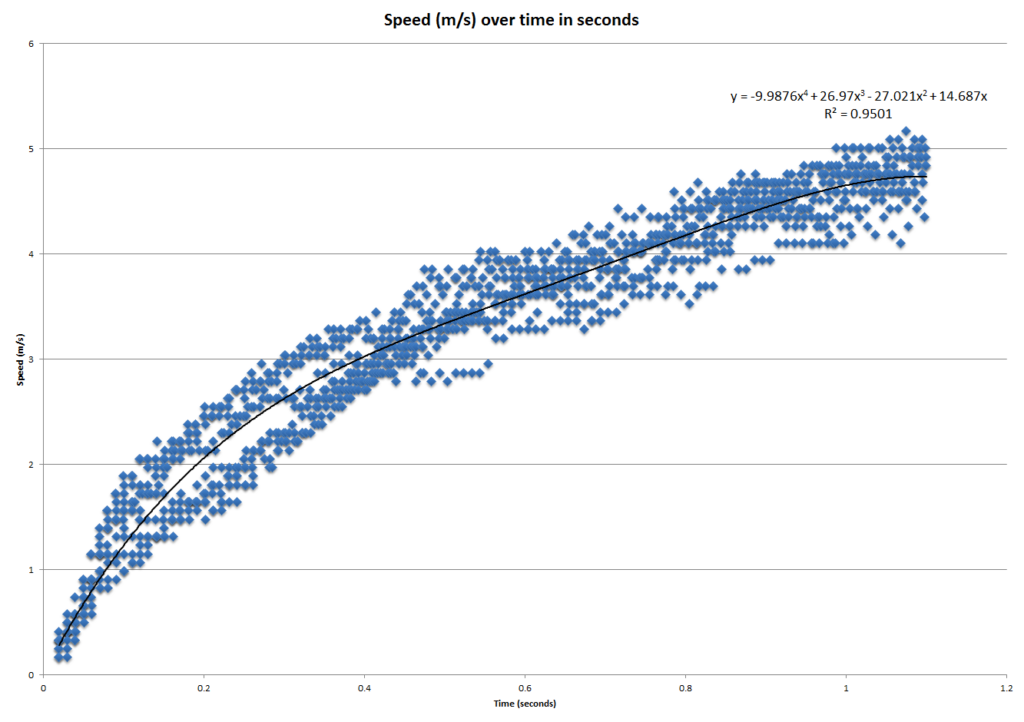
We used Excel to help us work out the best regression model. We tried different models and after a few tries, we identified the best fit seems to be a 4th order polynomial. Since we know the car started from a standstill, we could set the y-intercept to 0.
We have our speed curve equation:
y = -9.9876x4 + 26.97x3 – 27.021x2 + 14.687x
With R² = 0.9501, which means a statistically good fit. If you are interested to learn about regression, please follow this link here.
Finding the acceleration curve with calculus
With the equation, we can use differentiation in calculus to work out the acceleration curve
Replace y with s and x with t, we get:
s = -9.9876t4 + 26.97t3 – 27.021t2 + 14.687t
ds / dt = 4 × -9.9876t3 + 3 × 26.97t2 – 2 × 27.021t + 14.687
ds / dt = -39.9504t3 + 80.91t2 – 54.042t + 14.687
Therefore acceleration equation is -39.9504t3 + 80.91t2 – 54.042t + 14.687
Then we can use this equation to generate data points and convert data into figures that we need, for example:
From acceleration to motor torque
Net motor torque (Nm) = acceleration (m/s2) × radius (m) × mass (kg) ÷ gear ratio
From speed to motor RPM
Motor RPM = Speed (m/s) × gear ratio × 60 ÷ diameter of the wheel (in metre) ÷ Pi
From motor torque and motor RPM to horsepower
Horsepower = Torque × RPM ÷ 5,252
Finding the power curves
Let’s plot motor RPM and Motor torque (mNm) over time in seconds, with motor RPM in red and motor torque in blue.
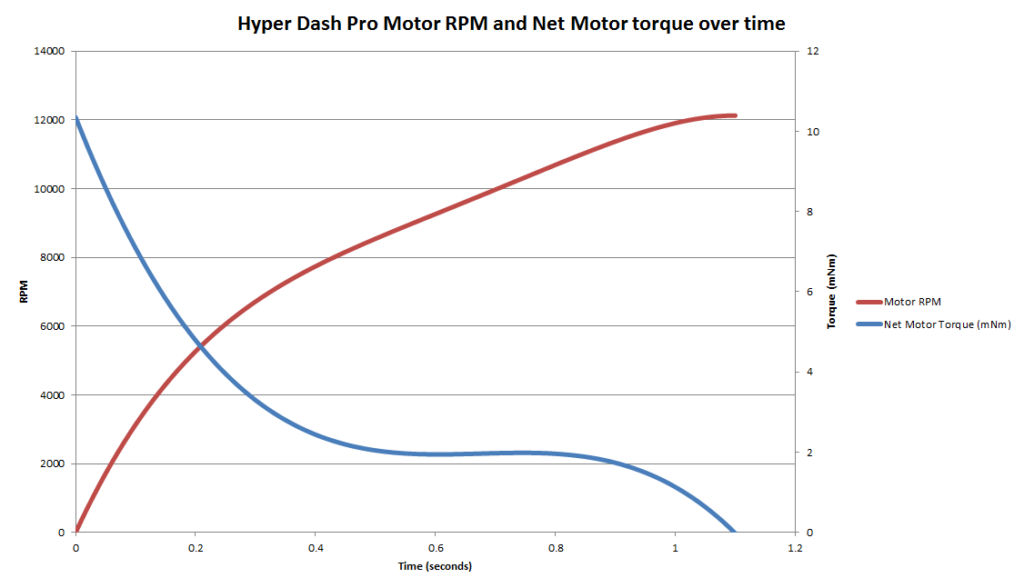
From this chart, we can clearly see the pattern of motor torque during each run from a standstill. The motor generated the most torque at the beginning and it dropped sharply over a short period of time (i.e. 0.5 seconds). Then it was pretty constant for a bit of time (i.e. 0.4 seconds) until it started tailing off as it reached close to maximum RPM.
Horsepower and torque curves
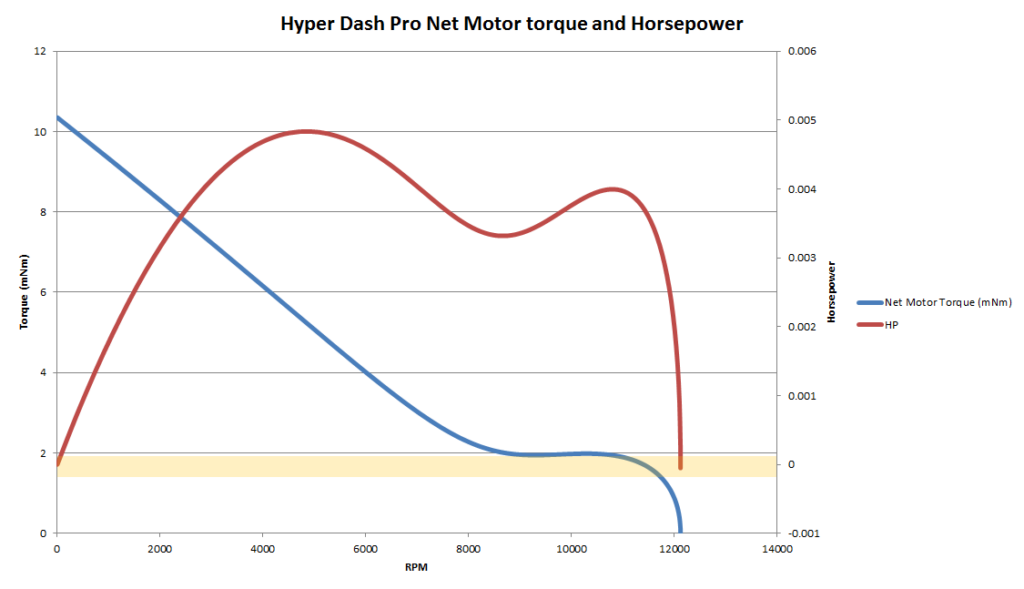
Now let’s plot the horsepower and motor torque (Nm) over motor RPM similar to any rolling road dyno chart we see from automobiles (cars), with horsepower in red and motor torque in blue.
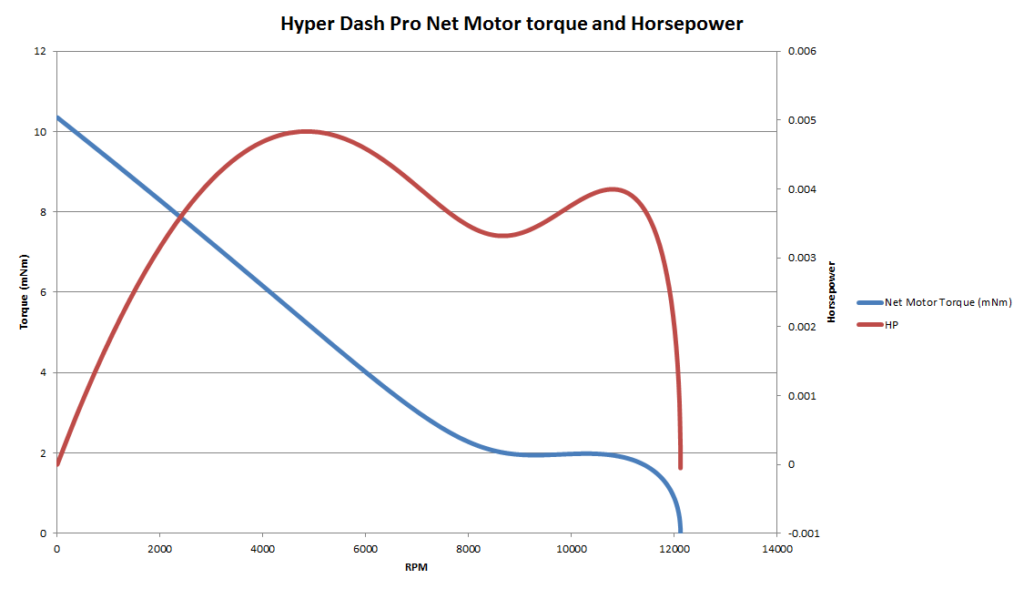
Comparing it to our hypothesis, all-in-all, it follows a similar pattern, but our power curves have a lot more intriguing details. Let’s examine.
The peak power was at around 5,000 RPM, then a dip in power at around 9,000 RPM. The power was going up again to the second peak at around 11,000 RPM, then the power tailed off quite quickly when the motor speed reached close to maximum RPM.
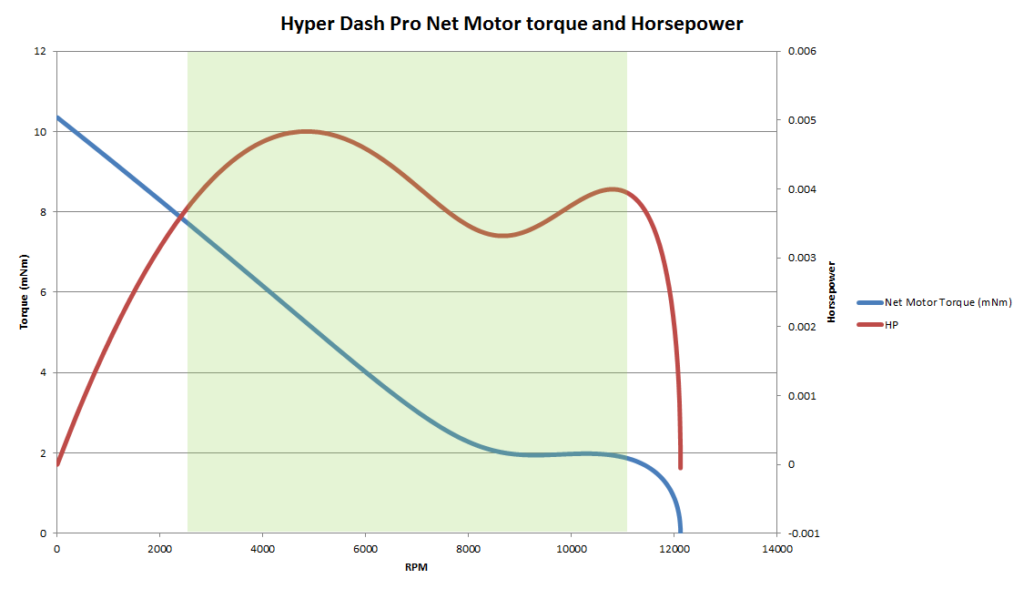
The sweet power band
Let’s find the sweet power band. The sweet power band was around 2,500 to 11,000 RPM. With 2.61cm wheel diameter and 3.5:1 gear ratio, it translates to a speed range of around 1 m/s to 4.3m/s. This means if we want our Mini 4WD to accelerate quickly, this is the best range to be in.
Comparing to spec
How do our measurements compare to spec? According to the Tamiya’s official spec, a Hyper-Dash PRO motor has a recommended torque between 1.4 – 1.9mNm. Our motor average net torque was around 3.05 mNm and the maximum torque was around 10.3 mNm. It is certainly different from what the official spec describes. Interestingly, between 9,000 and 10,000 RPM, the net motor torque was around 2.0mNm which was very close to spec (see below). Since we don’t know how Tamiya measures the torque of the motor, we can’t do an exact side by side comparison. But our results show us a more detail picture of the performance of our Tamiya Mini 4WD Hyper-Dash PRO motor than the official information provided so far.
In summary
We set out to find the power output and torque of a Tamiya Mini 4WD Hyper-Dash PRO motor. We collected twelve runs worth of data at our recent Mini 4WD social event in October 2023. By analysing the data we collected, we were able to generate a chart with the motor horsepower and net motor torque over an RPM range. The power and torque curves followed a similar pattern as stated in our hypothesis, although our curves show a more intriguing pattern than the standard model. The torque value from our experiment is different from the ones from the official spec. Since we don’t know how Tamiya test and measure their motors, we don’t know whether our result matches the official spec. We observed that the sweet power band for our motor was around 2,500 to 11,000 RPM. The peak horsepower is 0.0048 at around 5000 RPM and peak torque at the starting RPM of the motor.
What does the result mean to fellow racers?
To get the maximum performance of the Hyper-Dash PRO motor, we need to keep it running in the sweet power band region. From our experiment, we have identified this region to be around 2,500 to 11,000 RPM.
We can take advantage of this information by selecting the best matching gear ratios for the race circuit that we are competing at.
Certainly it would be easier to achieve this by having a Mini 4WD that can measure motor RPM or a simulator that can predict some of the results for us. In the meantime, we will have to test different gear ratios manually and measure the lap time or section time and compare the results in order to determine the best strategy. Definitely we can use science and maths to help us take some of the guess work out. This is something we can explore in the future articles.
Wrapping up
We have made another important progress in understanding the performance characteristic of a Tamiya Mini 4WD Hyper-Dash PRO motor. It is a win for all racers.
This experiment is by no means conclusive. Your setup might be different from ours which would create different results. But we hope that it provides you an interesting insight to the subject matter.
What would you take away from this experiment? How would you improve it? Please feel free to leave a comment on our Facebook page @Mini4Science.
Annex A – Experiment results
![7 different Tamiya Mini 4WD low profile small diameter tyres [Item no: 95208, 95205,95152, 95281, 95304]](https://mini4science.com/wp-content/uploads/2024/09/IMG_0538_mod2-150x150.jpg)
![8 different Tamiya Mini 4WD metal rollers [Item no: 95612, 15522, 95643, 95497, 15426, 95160, 15345, 15475]](https://mini4science.com/wp-content/uploads/2024/07/IMG_0296-150x150.jpg)


![7 different Tamiya Mini 4WD low profile small diameter tyres [Item no: 95208, 95205,95152, 95281, 95304]](https://mini4science.com/wp-content/uploads/2024/09/IMG_0538_mod2.jpg)
![8 different Tamiya Mini 4WD metal rollers [Item no: 95612, 15522, 95643, 95497, 15426, 95160, 15345, 15475]](https://mini4science.com/wp-content/uploads/2024/07/IMG_0296-scaled.jpg)