Introduction
Using the right set of gears can be a make or break decision. Some gear sets meant to give our Mini 4WD more top speed, some meant to give our Mini 4WD more acceleration and some meant to give a balance of the two.
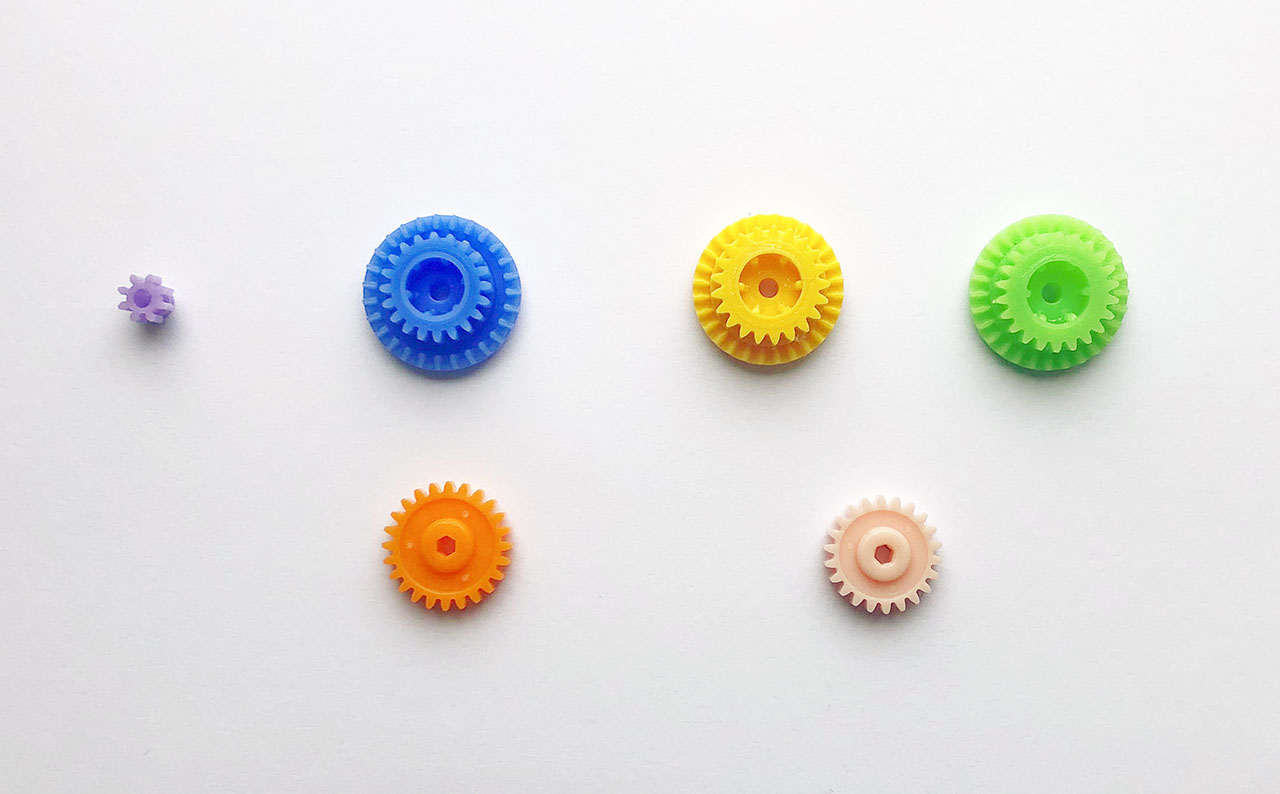
Tamiya released three different gear sets for the Mini 4WD PRO cars:
- (A) the blue and orange High Speed Gear Set (Gear Ratio 4:1) – Item No: 15355
- (B) the yellow and pink High Speed EX Gear Set (Gear Ratio 3.7:1) – Item No: 15429
- (C) the green and pink Super Speed Gear Set (Gear Ratio 3.5:1) – Item No: 15349
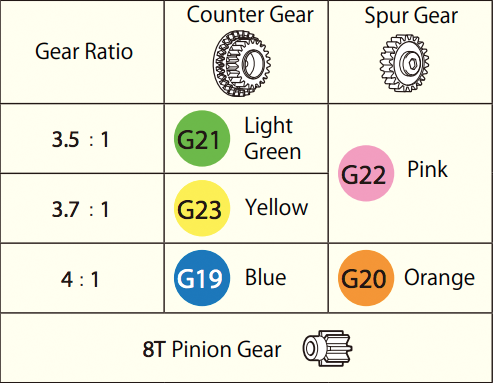
Some PRO cars comes with the green and pink 3.5:1 gear set as standard, some comes with the blue and orange 4:1 gear set as standard (especially many of the early cars with MS chassis and large diameter wheels). While, the yellow and pink gear set (3.7:1) is an upgrade option.
Looking at the three options as discussed in the Science 101 articles about Gear Ratios, we can classify the gear sets in three categories:
- (A) The blue and orange High Speed Gear Set (Gear Ratio 4:1 – actually 4.05:1) should gives us the best acceleration.
- (B) The the yellow and pink High Speed EX Gear Set (Gear Ratio 3.7:1 – actually 3.66667:1) should gives us the balanced of the two.
- (C) The green and pink super speed gear set (Gear Ratio 3.5:1) should gives us the highest top speed.
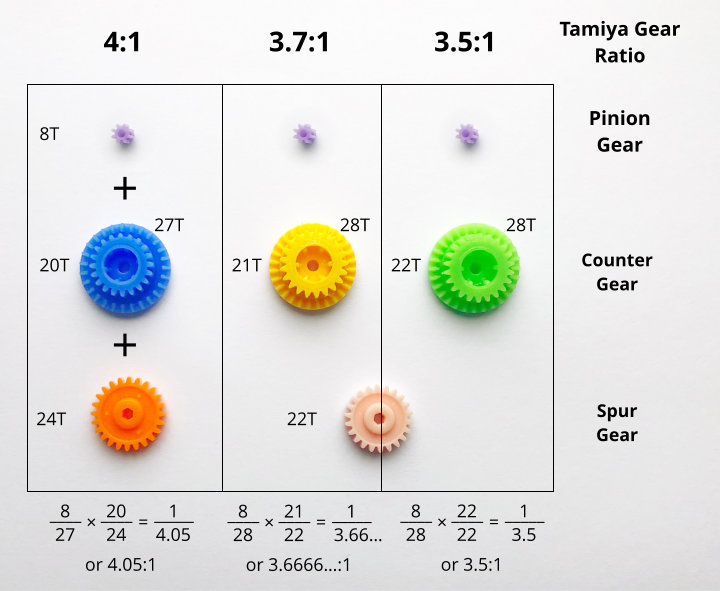
So the question is, do they make any difference? If yes, which one is the best? Let’s do some experiments to find out.
Hypothesis
Using the information from the Hyper-Dash PRO motor packaging, we can estimate the performance that we should expect to get from these 3 gear sets. I plotted the figures on the chart above. High speed (3.5:1), Balance (3.7:1) and High Torque (4:1). If you want to find out how I calculated these figures, please refer to the Science 101 Gear Ratios article.
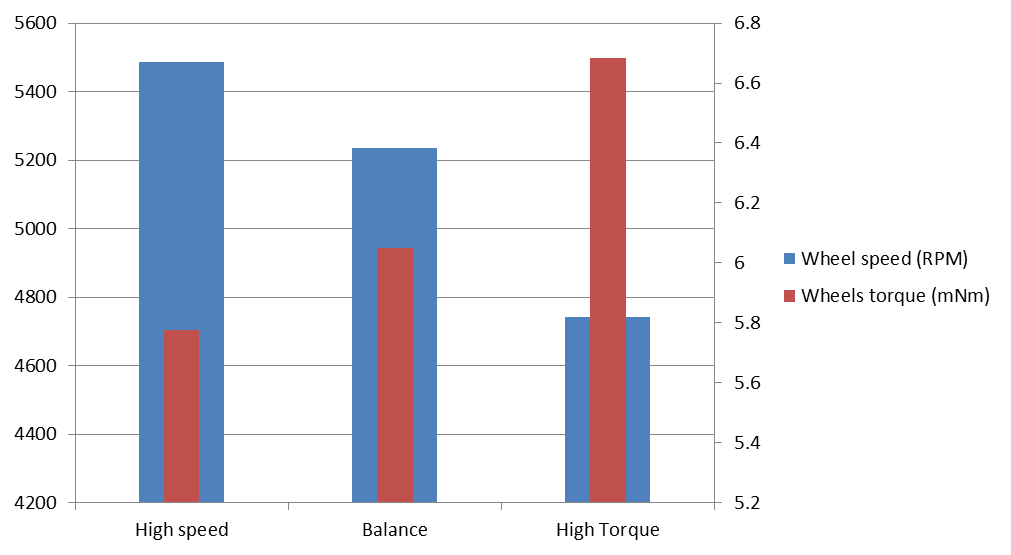
From the chart, for speed, the high speed gear set green and pink (3.5:1) should gives us the highest top speed, followed by balance (3.7:1) and lastly high torque (4:1). As for acceleration, the high torque gear set blue and orange (4:1) should gives us the highest acceleration, followed by balance (3.7:1) and lastly high speed (3.5:1)
Interestingly, the performance of the balance gear set (yellow and pink 3.7) is closer to the performance of the high speed gear set (green and pink 3.5:1) than the high torque gear set (blue and orange 4:1). There is a bigger jump between balance and high torque.
The hypothesis is that the measured result should follow a similar performance pattern as the estimated figures.
Test track
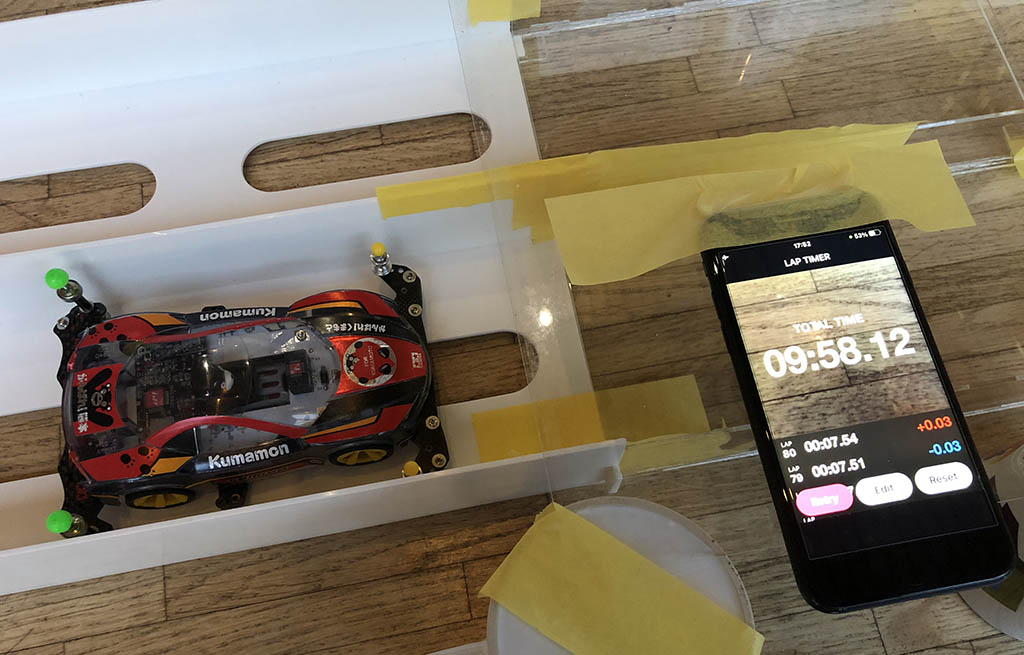
Similar to the test track that we used for motor tests, we are going to be testing the car in our two lanes Tamiya Mini 4WD Oval home circuit with extensions to make a bigger track with longer straights. We removed the bridge crossing. We will only use the outer lane to run the experiments
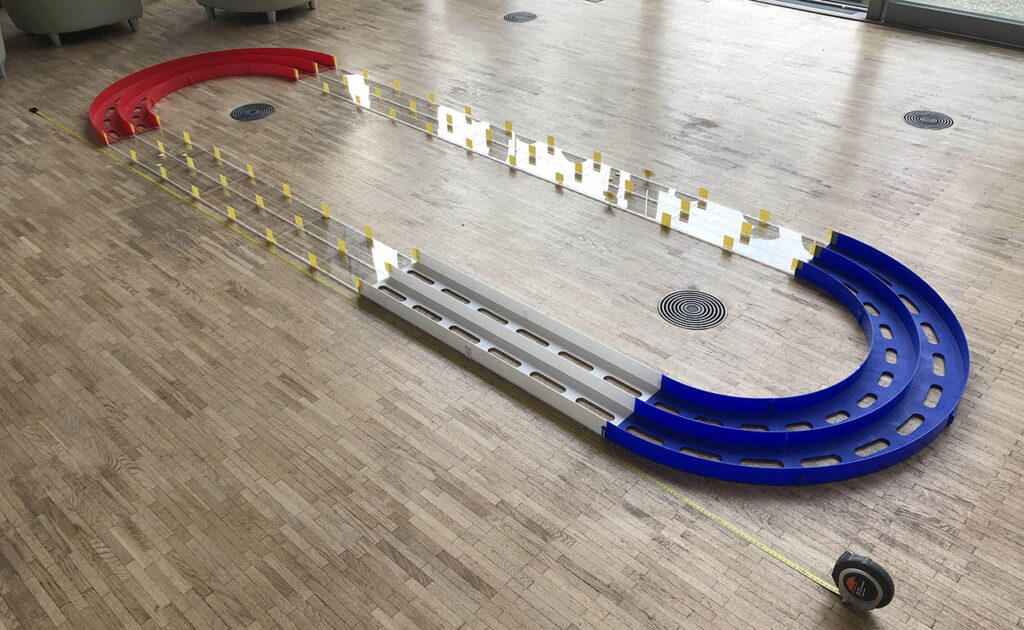
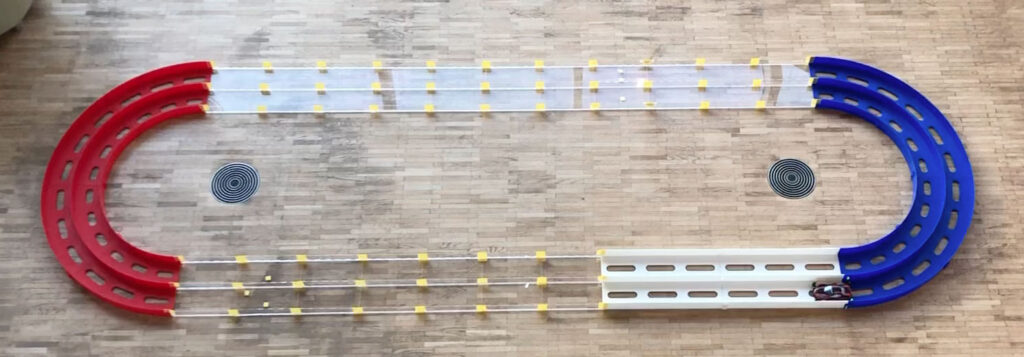
Based on data from Tamiya, we can calculate the length of the lap. We have 11 straight sections at 480mm length and two 180 turns with radius of 539cm ( ( 598mm – 480mm ) / 2 ) assuming the car travels in the centre of the lane.
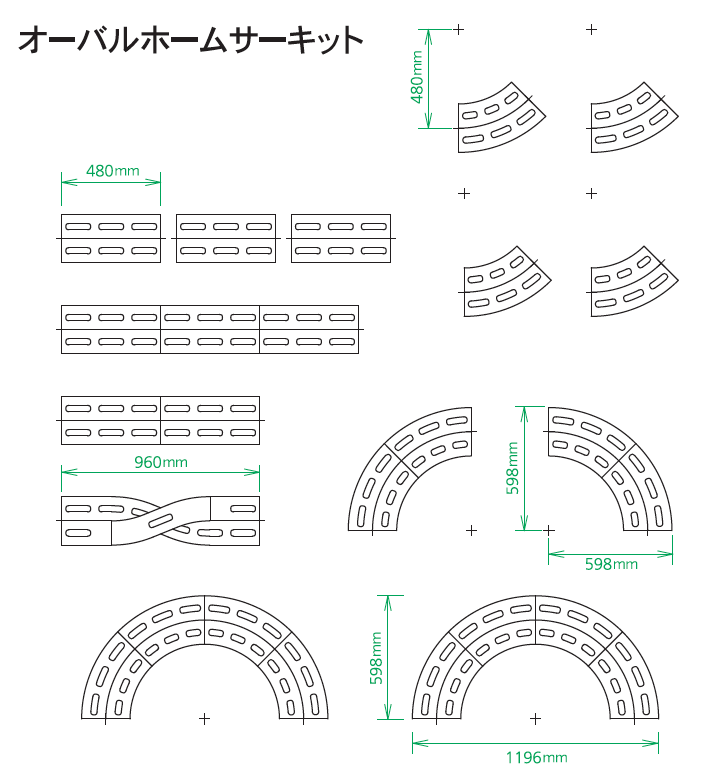
So the length of the circuit is ~8.66 metres long ( 11 × 480mm + 2 × PI × 539mm)
Test equipment
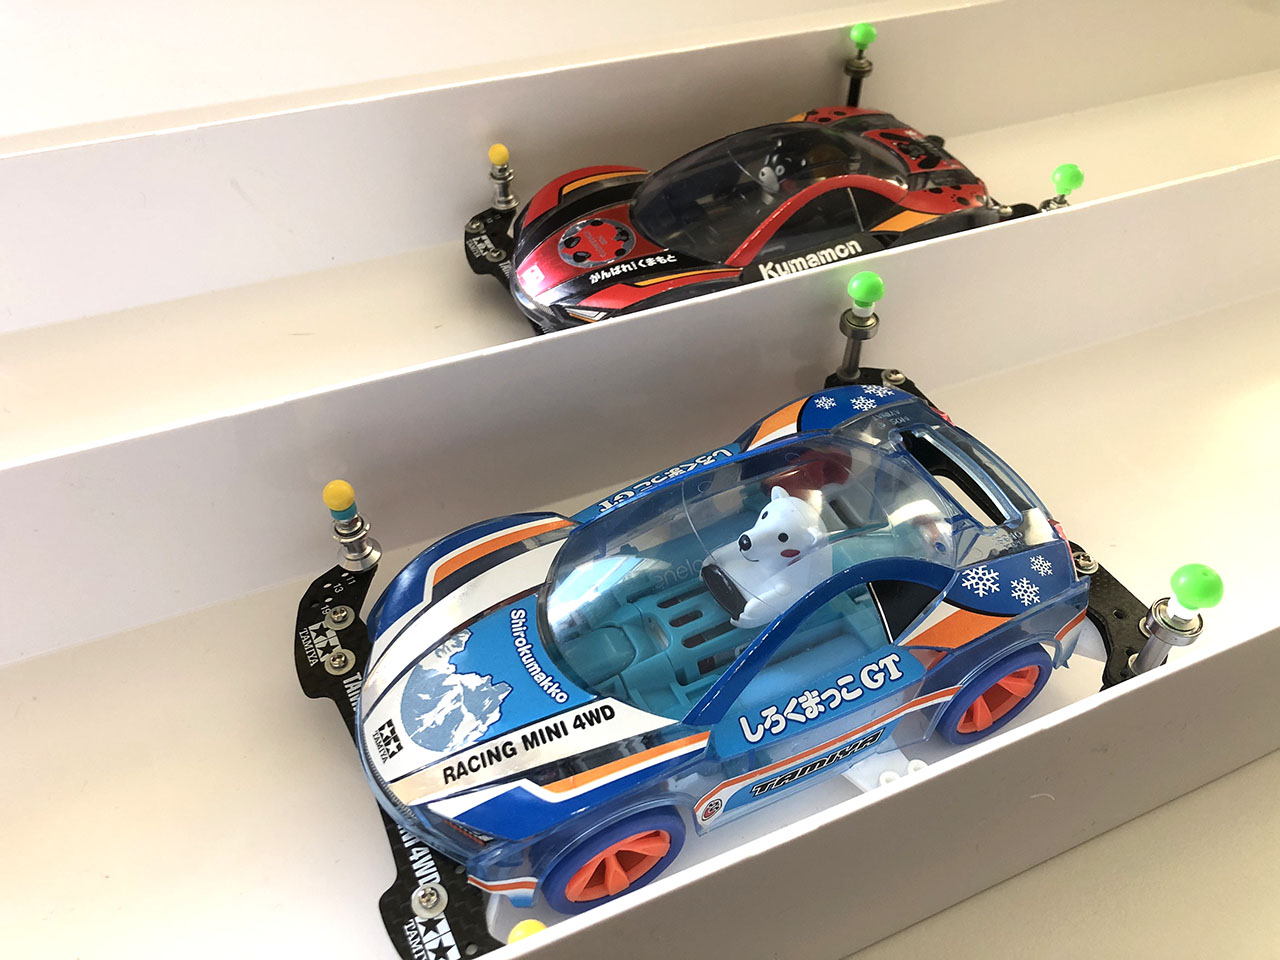
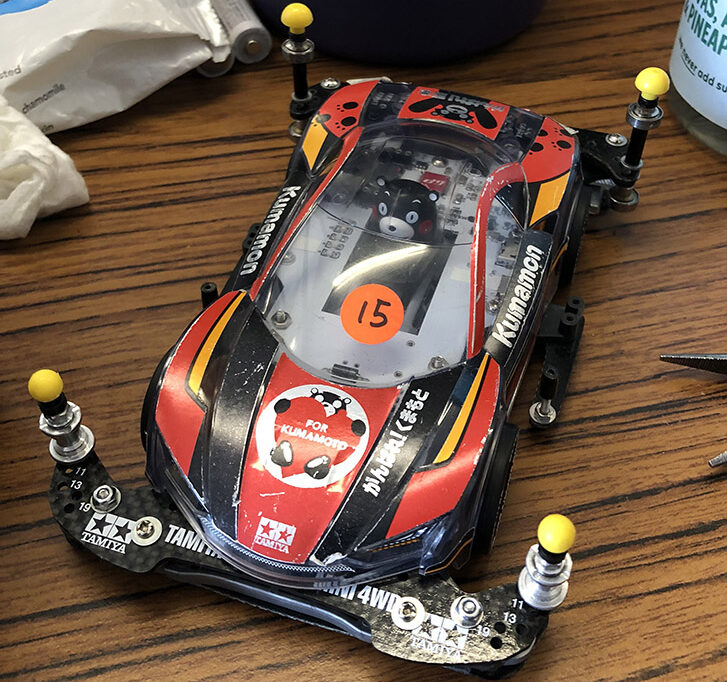
Car: Our Mini 4WD Mark 6b Development Prototype based on the Kumamon car. For more information please refer to Our Mini 4WD page.
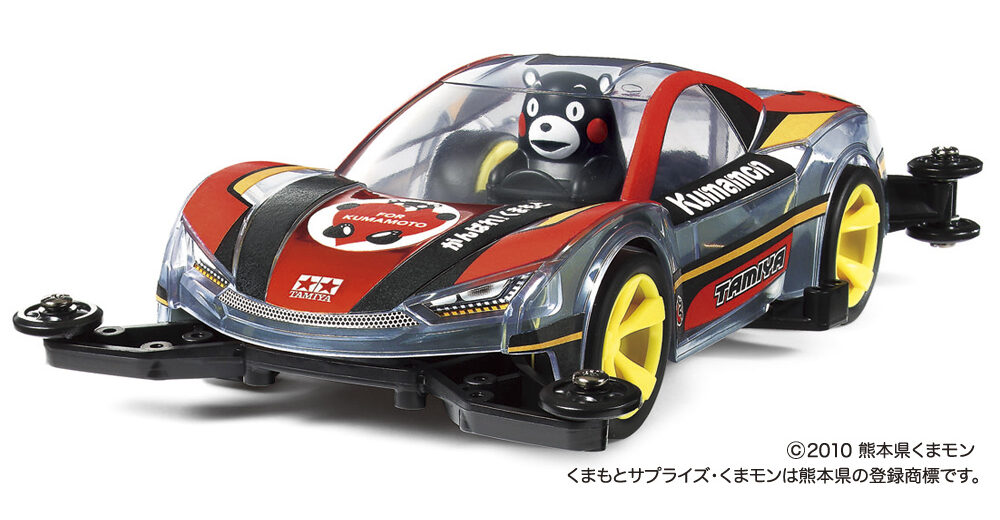
Chassis: MA Chassis
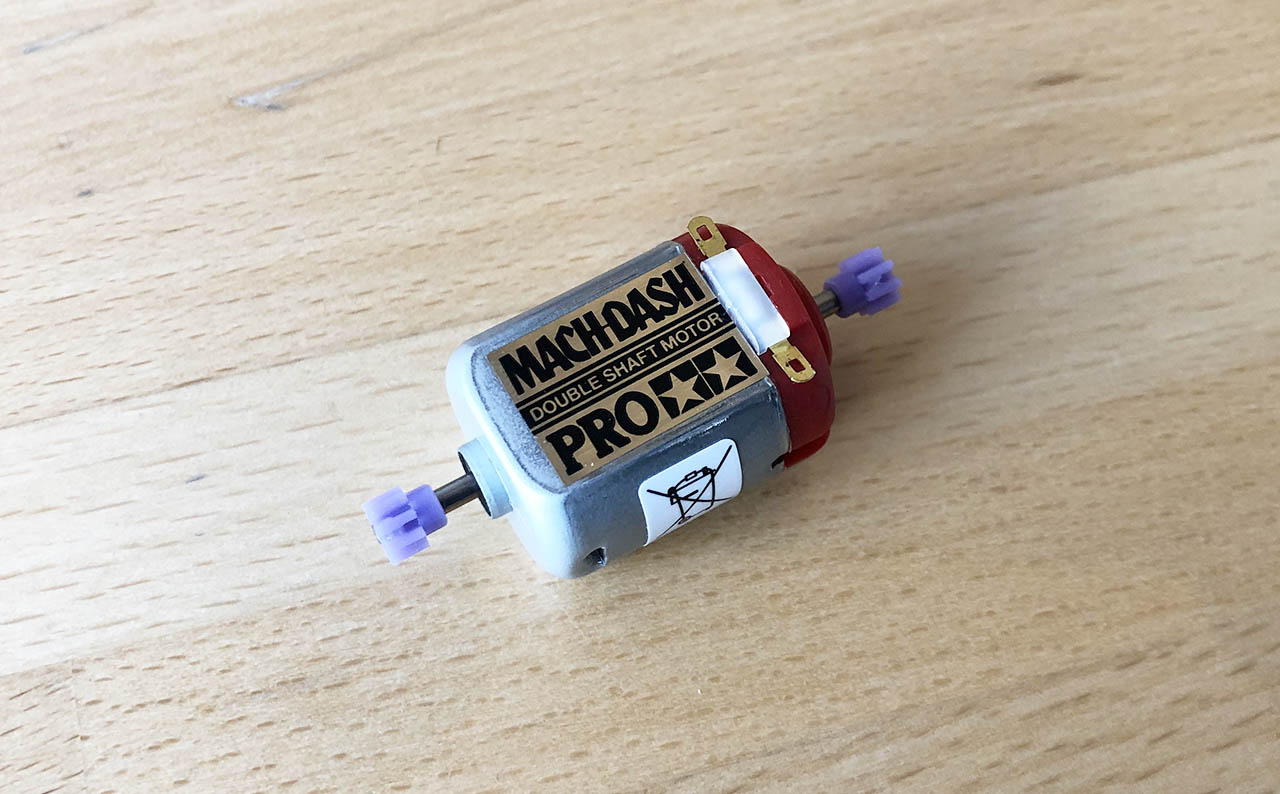
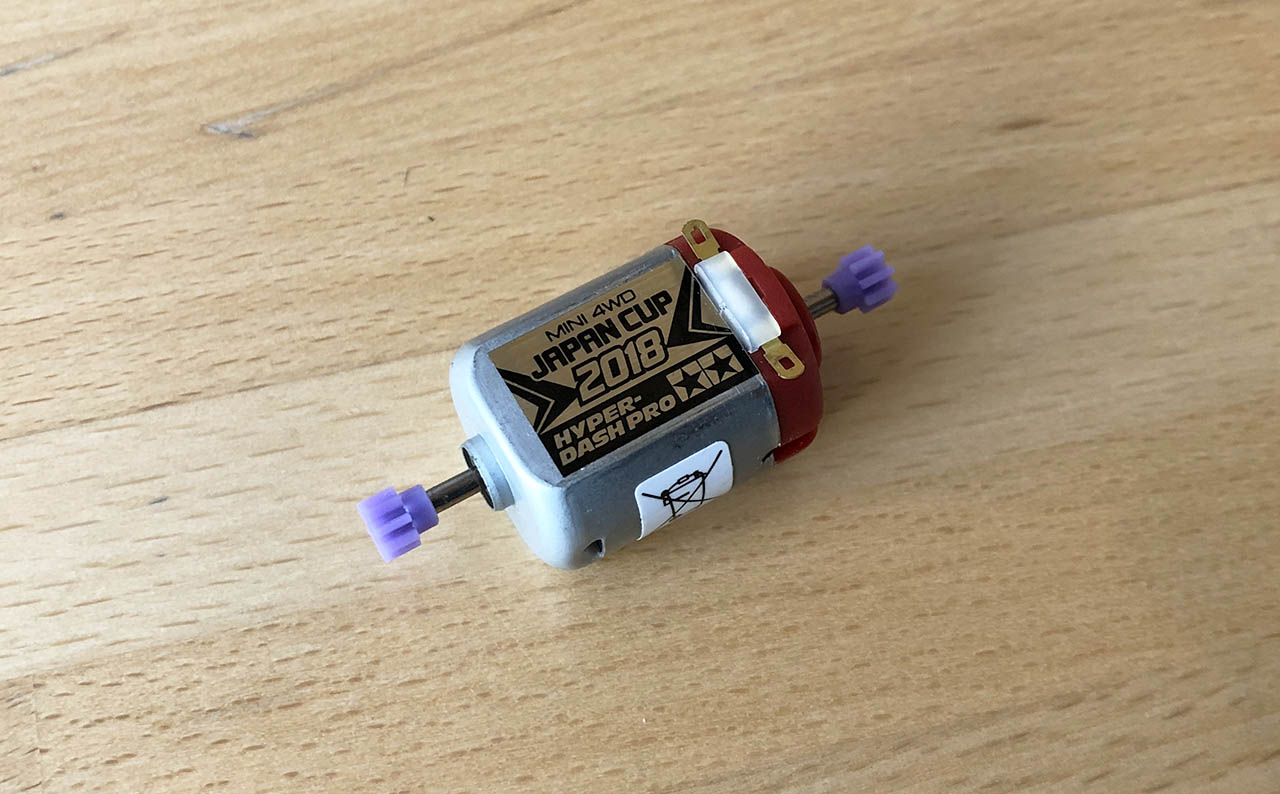
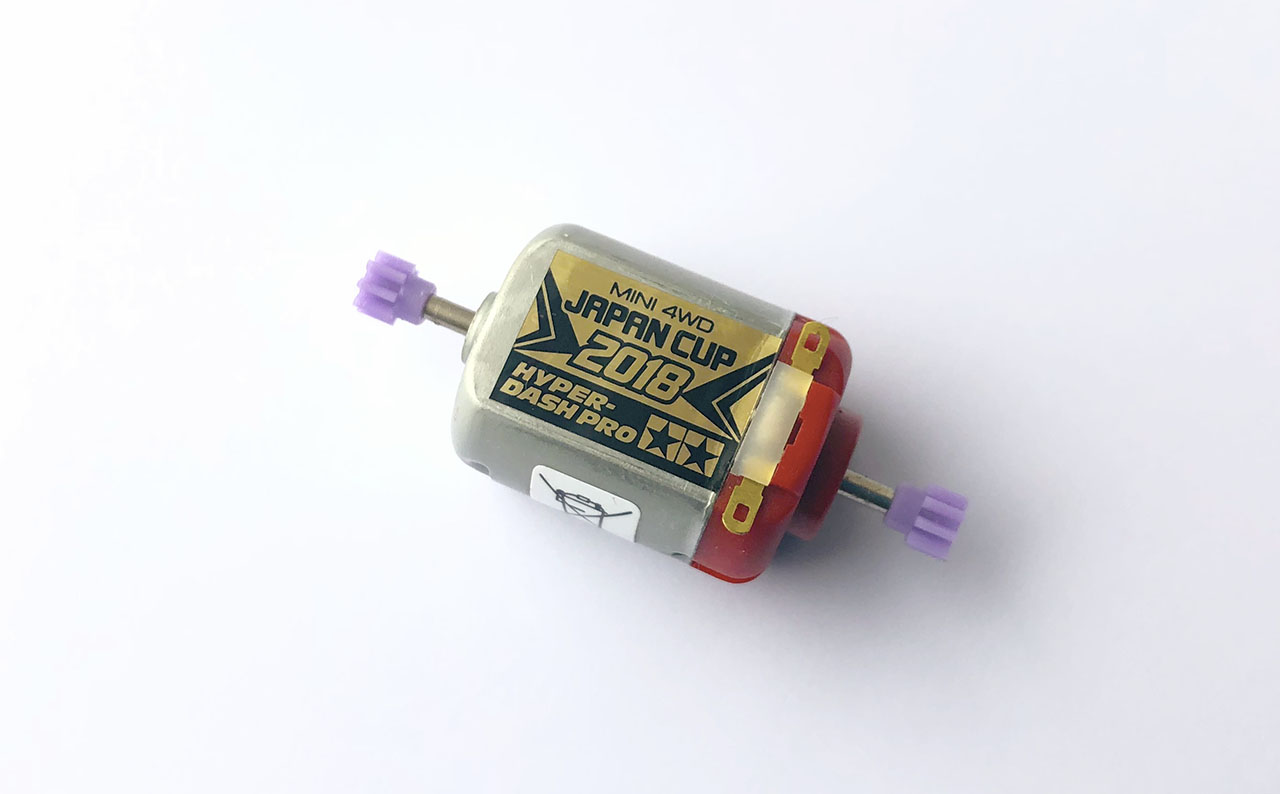
Motor: Tamiya Mini 4WD Hyper-Dash PRO 2020
Gear Ratio(s): 3.5:1, 3.7:1, 4:1
Wheel Diameter including tyres: 2.61 cm
Battery: Eneloop AA Light 950mAh batteries
Mass: 192 grams
Telematics: Custom built computer “M4S Mk1” to run the measuring program and to record data. It contains a Atmel ATSAMD21 Cortex M0 48Mhz processor (Arduino Zero), 6-axis gyroscope and accelerometer (MPU6050), high speed microSD Card to record data, a quartz crystal to help measure accurate time and a tachometer to measure distance.
Test methods
We are going to run the car around the circuit on the outer lane in clockwise direction. starting from the START grid. We will do three runs and each run will last for 30 seconds. The batteries will be fully re-charged before each run. The motor will be given enough time to cool down to avoid performance loss. After 3 runs, we will change the gear sets and run the same set of tests again to a total of 9 runs (3 for each gear set).
The on-board computer measures distance, time, acceleration and rotation every 10 milliseconds (0.01 seconds or 100 times a second) and records the data in the SD card in a CSV file format. After every run, I download the data to my laptop and analysis each run using our analytical tool while charging the battery and cooling down the motor. Our analytical tool enables us to analyse the results, calculate performance figures and generate some nice charts.
Calibration
As with many scientific experiments, one should calibrate the measuring equipment before conducting the experiment in order to produce a more accurate result. Here is how I tested the tachometer and clock.
Tachometer accuracy test
I used my desk to measure the accuracy of the tachometer. I measured the length of my desk, it is 120.2cm long. I measured the length of the Mini 4WD test car, it is 15cm long. If I manually and steadily move the test car from one end of the desk (rear bumper at the end) to the other (front bumper at the end), at a steady speed as much as I can and going as straight as possible, the car should have moved 120.2cm – 15cm = 105.2cm. So I ran this test three times and checked the readings from the tachometer. Here are the results from the three runs.
- 104.95
- 104.54
- 104.54
Average: 104.68 cm, error rate: ~0.4%. That’s not bad at all. I probably didn’t line up the car perfectly enough.
Clock accuracy test
I tested the clock against a stop watch. To test the clock on the test car, I setup the test car to blink the on-board LED status light every 5 seconds. I used a stop watch to time the interval manually. I ran the test for about 35 seconds and here is the result:
- 00:00:05.136
- 00:00:04.891
- 00:00:05.040
- 00:00:05.062
- 00:00:05.098
- 00:00:04.945
Average: ~5.029 seconds, error rate ~0.6%. That’s not bad at all. My reaction time probably caused the error.
So from the two tests, they show that the tachometer and the clock are pretty accurate with very low error rate.
Considerations
Resistive forces such as air friction, mechanical friction and tyre friction can affect the outcome. The condition of my batteries e.g. charged voltage and internal resistance, motor condition e.g. run-in or worn out and electrical resistance in the circuit can also affect the outcome. Tyre skid is an issue as the tachometer will read the wheel turning motion even the car might not be moving as fast. We filmed the running of the car so we can compare the findings later.
Results
3.5:1 gear set
1st Run
Here is a chart showing the speed of the car from the first run. We have speed in metre per second on the Y axis (vertical) and time in mini-seconds on the X axis (horizontal).

The car accelerated from a standstill to about 6.5 m/s. Then the speed changed depending on whether the car was traveling in a straight section or a turn. In the straights, the car accelerated to faster speed and it slowed down when it entered the 180 degrees turn and continued to slow down until it exited a turn. Hence we see a saw tooth pattern on the chart.
Top speed

The top speed of the car was 7.3 m/s. It happened at around 12.9 seconds. The Motor RPM was 18,690. We added a pair of green lines to highlight the top speed.
Average Speed

To get a representative average speed, we ignored the data during initial acceleration and the final slow down (marked by the grey areas), then we calculated the result using the data in the middle section. The average speed was around 6.56 m/s and Motor RPM was 16,794. (see blue line)
Acceleration

Similar to our previous experiments, the motor pushed the forward car the strongest from standstill and the acceleration decreased as the speed built up until it gradually flattened. The shape of the speed curve looks like a logarithmic curve. To keep it simple, we picked a spot at around 0.8 seconds and used that to calculate the average acceleration from standstill (see blue line). The result was 6.15 m/s2.
Now let’s do the same analysis for the 2nd and 3rd run. And repeat the same process for the 3.7:1 gear set and the 4:1 gear set. You can find the detail charts in the Annex A section at the end of this report. To make it easier to examine the result, I have summaried each set of result into tables and charts below.
3.5:1 gear set – result after 3 runs
Here is a table showing the test results for Hyper-Dash PRO with 3.5:1 geat set from the three runs. You can also find the average value per line of the three runs in the last column under “Average”. Motor torque was calculated from acceleration figures based on the formula mentioned in Science 101 Torque and Acceleration article.
| Gear set 3.5:1 | 1st Run | 2nd Run | 3rd Run | Average |
|---|---|---|---|---|
| Top Speed (m/s) | 7.3 | 7.3 | 7.38 | 7.33 |
| Top Speed Motor RPM | 18,690 | 18,690 | 18,900 | 18,760 |
| Average Speed (m/s) | 6.56 | 6.55 | 6.59 | 6.57 |
| Standard deviation | 0.25 | 0.26 | 0.26 | 0.26 |
| Min | 5.99 | 5.9 | 5.99 | 5.96 |
| Max | 7.3 | 7.3 | 7.38 | 7.33 |
| Range | 1.31 | 1.4 | 1.39 | 1.37 |
| Average Speed Motor RPM | 16,794 | 16,785 | 16,885 | 16,821 |
| Speed variance | 11.3% | 11.5% | 12.0% | 11.6% |
| Acceleration from standstill (m/s2) | 6.15 | 6.04 | 6.25 | 6.15 |
| Motor Torque from standstill (mNm) | 4.33 | 4.26 | 4.41 | 4.33 |
Let’s plot the top speed, average speed and acceleration in a chart to visualise the data.
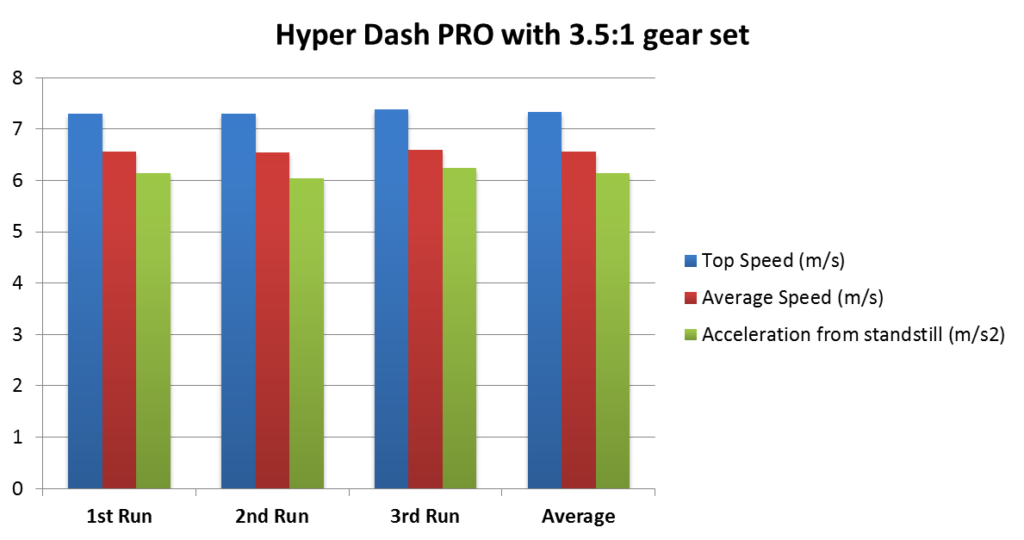
The result from each run is quite consistent with each other.
3.7:1 gear set – result after 3 runs
Here is a table showing the test results for Hyper-Dash PRO with 3.7:1 geat set from the three runs.
| Gear set 3.7:1 | 1st Run | 2nd Run | 3rd Run | Average |
|---|---|---|---|---|
| Top Speed (m/s) | 7.05 | 7.22 | 7.13 | 7.13 |
| Top Speed Motor RPM | 18,920 | 19,360 | 19,140 | 19,140 |
| Average Speed (m/s) | 6.41 | 6.46 | 6.46 | 6.44 |
| Standard deviation | 0.25 | 0.26 | 0.26 | 0.26 |
| Min | 5.82 | 5.9 | 5.9 | 5.87 |
| Max | 7.05 | 7.22 | 7.13 | 7.13 |
| Range | 1.23 | 1.32 | 1.23 | 1.26 |
| Average Speed Motor RPM | 17,187 | 17,339 | 17,325 | 17,284 |
| Speed variance | 10.0% | 11.8% | 10.4% | 10.7% |
| Acceleration from standstill (m/s2) | 5.91 | 5.73 | 5.85 | 5.83 |
| Motor Torque from standstill (mNm) | 3.97 | 3.85 | 3.94 | 3.92 |
Let’s do the same and plot the top speed, average speed and acceleration in a chart to visualise the data.
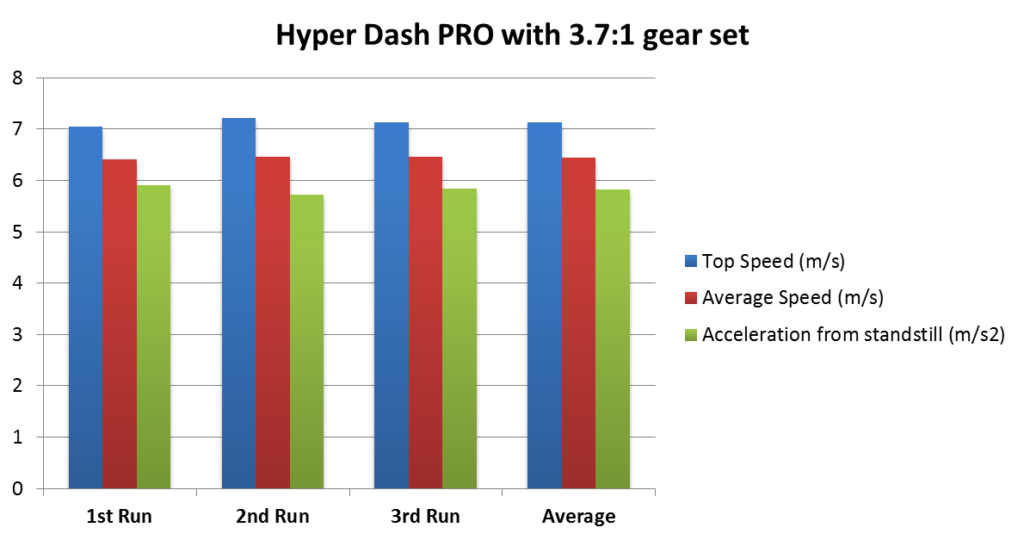
The result from each run is also quite consistent with each other.
4:1 gear set – result after 3 runs
Here is a table showing the test results for Hyper-Dash PRO with 4:1 geat set from the three runs.
| Gear set 4:1 | 1st Run | 2nd Run | 3rd Run | 3rd Run |
|---|---|---|---|---|
| Top Speed (m/s) | 6.72 | 6.89 | 6.81 | 6.81 |
| Top Speed Motor RPM | 19,680 | 20,160 | 20,169 | 20,003 |
| Average Speed (m/s) | 6.08 | 6.25 | 6.23 | 6.19 |
| Standard deviation | 0.24 | 0.23 | 0.23 | 0.23 |
| Min | 5.58 | 5.74 | 5.74 | 5.69 |
| Max | 6.72 | 6.89 | 6.81 | 6.81 |
| Range | 1.14 | 1.15 | 1.07 | 1.12 |
| Average Speed Motor RPM | 17,799 | 18,301 | 18,473 | 18,191 |
| Speed variance | 10.5% | 10.2% | 9.3% | 10.0% |
| Acceleration from standstill (m/s2) | 6 | 6.23 | 5.94 | 6.06 |
| Motor Torque from standstill (mNm) | 3.66 | 3.79 | 3.62 | 3.69 |
Let’s do the same and plot the top speed, average speed and acceleration in a chart to visualise the data.
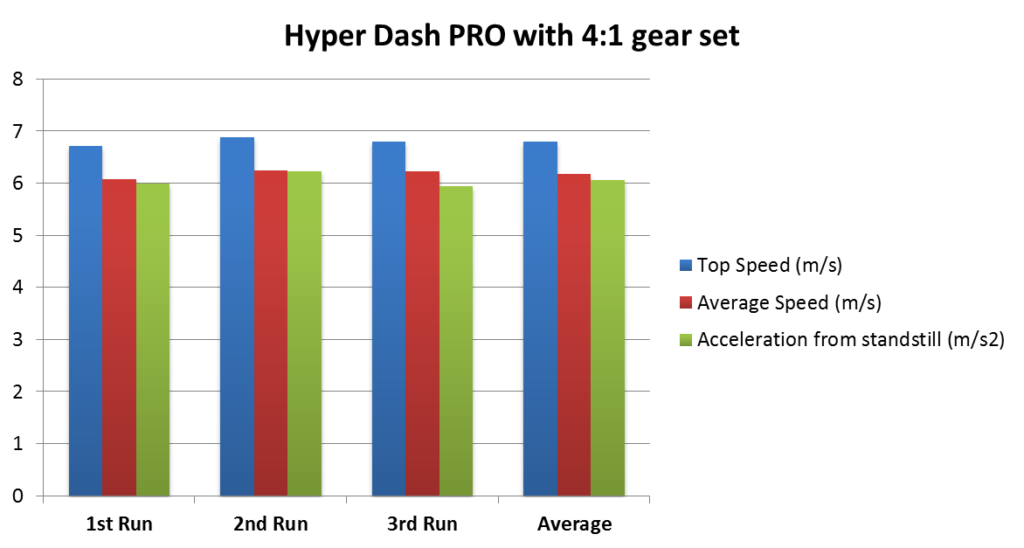
The top speed and average speed from each run is also quite consistent with each other. But the acceleration figure is slightly more vary.
Evaluation
From the motor tests we did before, we noticed the performance we got might not match the official spec. The goal here is not to compare the motor performance with spec, but rather to examine the effect of the different gear ratios on the performance of our Hyper-Dash PRO motor.
Overall
Let’s estimate the performance we should expect to get with each gear set on Hyper-Dash PRO and use it a guide to help us see whether our result follows the same pattern.
| From spec | 4:1 | 3.7:1 | 3.5:1 |
|---|---|---|---|
| Top Speed (m/s) | 7.15 | 7.90 | 8.28 |
| Average Speed (m/s) | 6.48 | 7.16 | 7.50 |
| Acceleration (average) (m/s2) | 2.67 | 2.41 | 2.30 |
Let’s plot these figures in a chart to visualise the data.
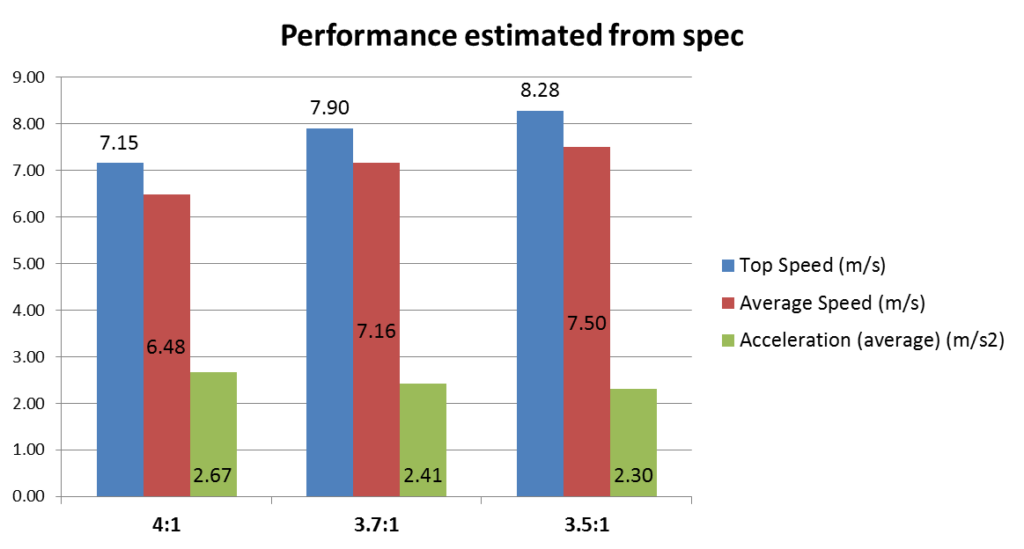
All in all, we should expect to get more speed with lower gear ratios (e.g. 3.5:1) and more acceleration with higher gear ratios (e.g. 4:1)
Let’s see what we got from our test results:
| From measurement | 4:1 | 3.7:1 | 3.5:1 |
|---|---|---|---|
| Top Speed (m/s) | 6.81 | 7.13 | 7.33 |
| Average Speed (m/s) | 6.19 | 6.44 | 6.57 |
| Acceleration from standstill (m/s2) | 6.06 | 5.83 | 6.15 |
Let’s plot top speed, average speed and acceleration from our measurements on a chart:
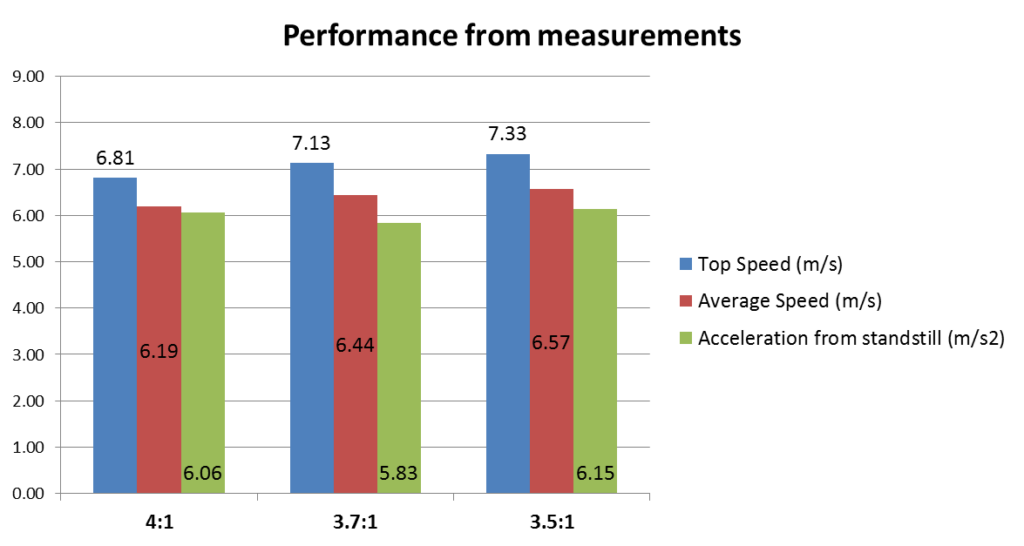
In terms of speed (blue and red bars), it follows the same pattern as the estimates. We can see that the high speed gear set (green and pink 3.5:1) gave us the highest top speed and average speed, followed by balance (3.7:1) and lastly (4:1), sloping up from left to right.
The performance of 3.5:1 and 3.7:1 gear set is closer to each other as observed in the hypothesis section above.
In terms of acceleration (green bars), we can see that strangely the high speed gear set (green and pink 3.5:1) gave us the highest acceleration, followed by high torque gear set (blue and orange 4:1) and lastly the balance gear set (yellow and pink 3.7:1). It didn’t follow the pattern we expected. The high speed gear set (green and pink 3.5:1) test result seems to be the outlier.
Why did we get this strange result?
Human error? As mentioned in the motor test articles, acceleration measurements required a bit of manual judgement, so perhaps we didn’t pick the right set of data.
Volatility? Battery performance, motor state and tyre grip can all affect acceleration performance. If we could do more runs, we should be able to get a better overall picture. Perhaps we should look into repeating the same experiment with more runs in the near future.
More detail look
Let’s take a closer look at the data and see what we can find.
Top Speed
Let’s examine the distribution of the top speed measurements from all the runs. The vertical axis is top speed and the horizontal axis is gear ratio. A trend line was added to help us see the pattern.
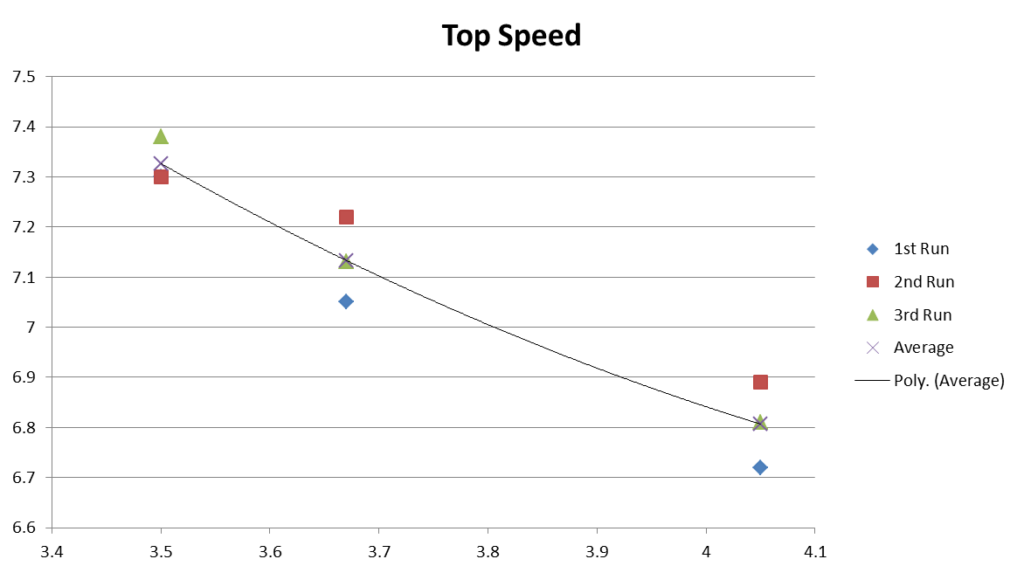
In terms of top speed, the result follows a similar pattern as predicted. The change of top speed based on gear ratio almost follows a straight line. There are more speed variations among the three runs for the 4:1 gear set than the 3.5:1 gear set.
Average Speed
Let’s examine the distribution of the average speed measurements from all the runs. The vertical axis is average speed and the horizontal axis is gear ratio. A trend line was added to help us see the pattern.
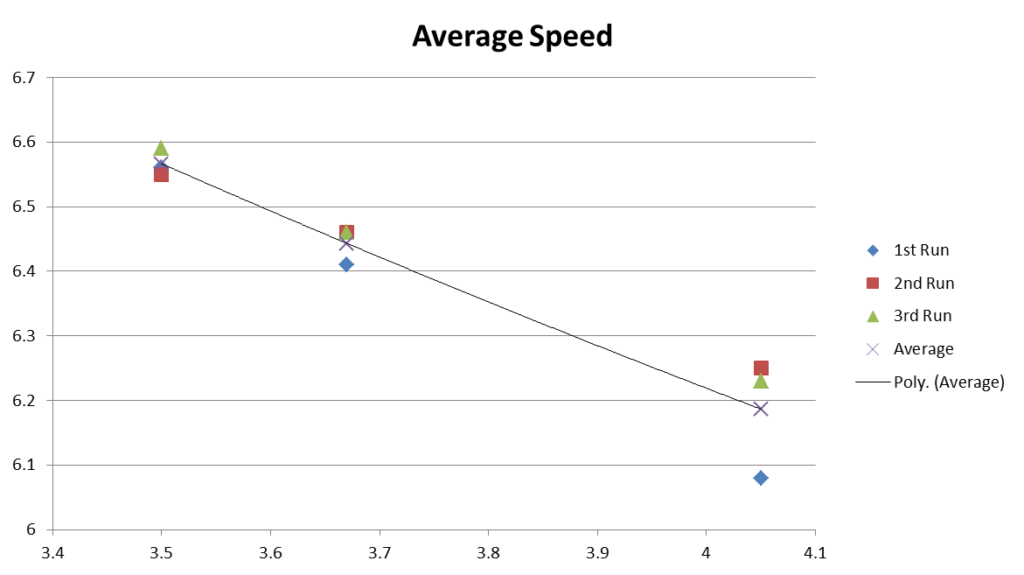
In terms of average speed, the result follows a similar pattern as predicted. The change of average speed based on gear ratio is pretty much a straight line. There are more speed variations among the three runs for the 4:1 gear set than the 3.5:1 gear set.
Acceleration
Let’s examine the distribution of the acceleration measurements from all the runs. The vertical axis is acceleration and the horizontal axis is gear ratio. A trend line was added to help us see the pattern.
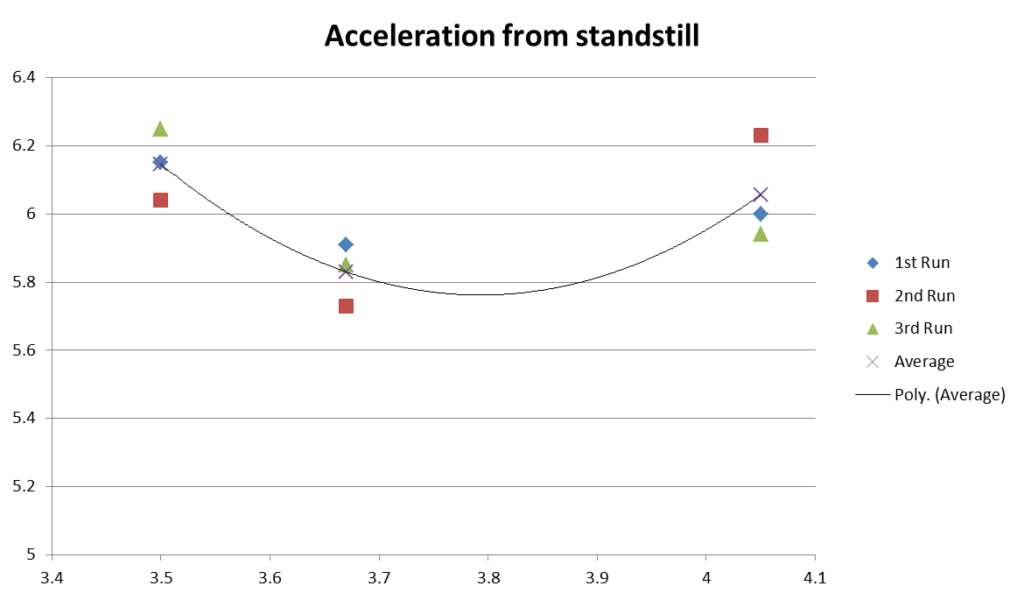
In terms of acceleration, we expect to get more acceleration with the higher gear ratio e.g. the 4:1 than lower gear ratios e.g. the 3.5:1. We expect to see a trend line sloping upwards from left to right. However, as observed previously, the result doesn’t follow our prediction. Based on our measurements, the 3.5:1 gear set produced the highest acceleration on average among the three gear sets.
Similar to previous pattern, there are more acceleration variations among the three runs for the 4:1 gear set than the 3.5:1 gear set.
Overall, it seems we get higher volatility of result per run with higher gear ratios such as the 4:1.
Marginal gain
Let’s examine the marginal gain of different gear sets. We calculate the figures based on both from tamiya spec and from our measurements. We use the 4:1 gear ratio as anchor point to calculate the percentage gain or loss with different gear sets.
| Estimates from spec | 4:1 | 3.7:1 | 3.5:1 |
|---|---|---|---|
| Top Speed delta % | – | 10.5% | 15.7% |
| Average Speed delta % | – | 10.5% | 15.7% |
| Acceleration delta % | – | -9.5% | -13.6% |
| Results from measurement | 4:1 | 3.7:1 | 3.5:1 |
|---|---|---|---|
| Top Speed delta % | – | 4.8% | 7.6% |
| Average Speed delta % | – | 4.1% | 6.1% |
| Acceleration delta % | – | -3.7% | 1.5% |
Let’s plot the marginal gain of top speed, average speed and acceleration in a chart to visualise the data.
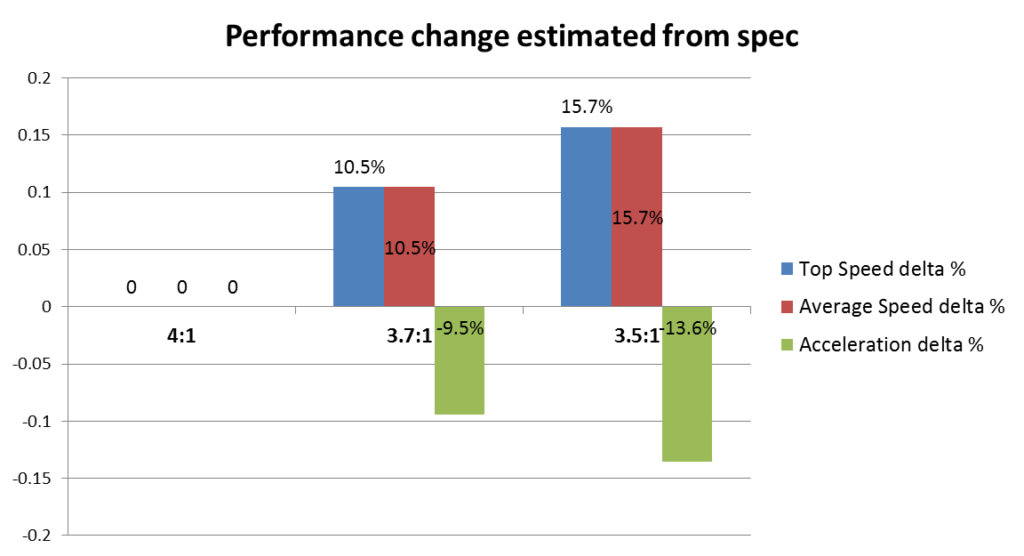
Chart showing the performance change estimate of a Tamiya Mini 4WD Hyper-Dash PRO motor with different gear ratios based on specification
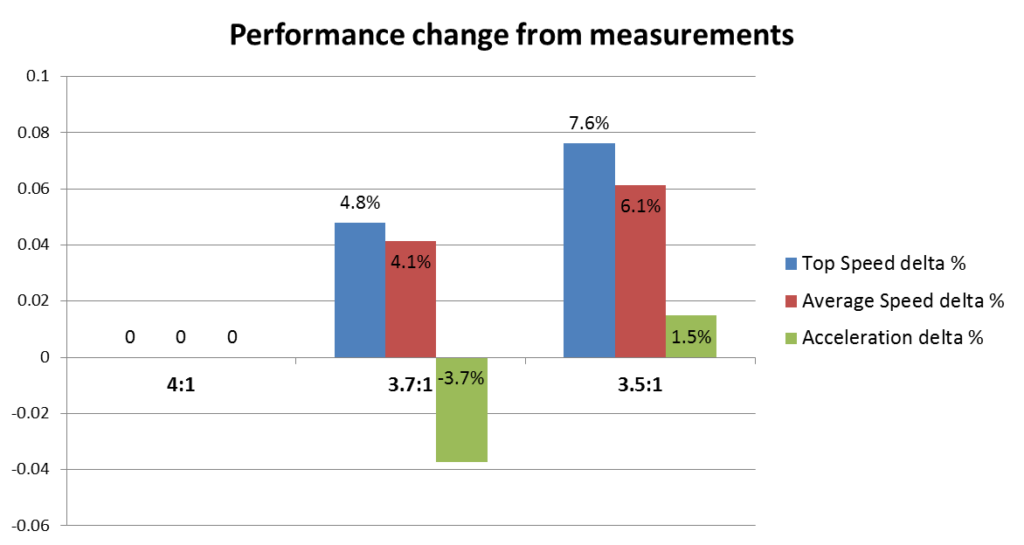
When changing from 4:1 gear set to 3.5:1 gear set, we expect the top speed/average speed goes up by ~15.7% and the acceleration reduces by around ~13.6%. However, from our measurements, the top speed went up only by around 7.8% and the average speed went up by 6.1%.
For acceleration, we can’t quite compare the marginal gain when changing from 4:1 gear set to 3.5:1 gear set as we had some very strange result. But we can still compare the marginal gain when chaning from 4:1 gear set to 3.7:1, the acceleration decreased by 3.7% instead of 9.5%.
So all in all, it is a smaller marginal gain than predicted. We suspect it has something to do with the peak performance and the torque curve of the Hyper-Dash PRO motor. From the charts, we can see that the torque curve is definitely not a straight line, but rather a curve.
Speed variances
| From measurement | 4:1 | 3.7:1 | 3.5:1 |
|---|---|---|---|
| Top Speed (m/s) | 6.81 | 7.13 | 7.33 |
| Average Speed (m/s) | 6.19 | 6.44 | 6.57 |
| Standard deviation | 0.23 | 0.26 | 0.26 |
| Speed variance | 10% | 11% | 12% |
Let’s plot speed variance (top speed minus average speed divided by average speed converted in to percentage) and standard deviation in a chart to visualise the data.
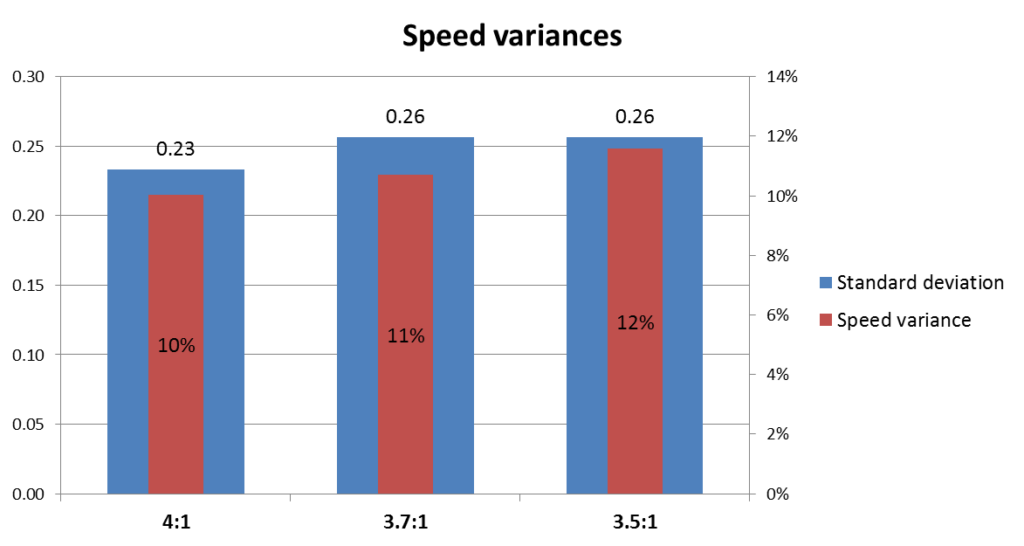
As discussed in the motor test reports, the lower the variances, the more consistent outcome we get when running the car on the track. The 4:1 gear set has the lowest speed variances based on our measurement so it should will give you the most consistent outcome.
However each run can be different from each other as seen in the distribution charts above. So from a macro level (across multiple runs), using a gear set with a higher gear ratio can create more variability (less consistent outcome), but from a micro level (looking at the speed in a run), using a gear set with higher gear ratio can create less variability (more consistent outcome). I can not think of a reason why this is the case. What do you think? If I have some new ideas, I will add my thoughts here.
In summary
We set off to measure the performance effect of the three gear sets for the Tamiya Mini 4WD PRO cars with a Hyper Dash PRO motor and we got some very interesting results.
Going back to our initial questions (1) do different gear sets make any performance difference? (2) which gear set is the best?
For question (1), the three gear sets (3.5:1, 3.7:1 and 4:1) does give us different performance characteristics: from high speed, balance to high acceleration. But the marginal gain based on our measurement was lower than predicted. Although the marginal gain is lower, it is still significant enough to provide a difference. In a race where every seconds count, every little performance gain can make a difference between winning and losing, so it is not to be ignored.
Based on our measurements, if you want the highest speed, go for the green and pink 3.5:1 gear set. If you want the highest acceleration, scientifically, you should go for the blue and orange 4:1 gear set but for some strange reason, our result did not show us that. The yellow and pink balance gear set 3.7:1 surprisingly gave the worst acceleration. We need to re-examine this in the near future to understand what is really happening.
(2) Which one is the best gear set for Hyper Dash PRO?
The common wisdom is that for technical circuit, choose the gear set that gives you more acceleration and for high speed circuit, choose the gear set that gives you higher top speed. The best gear set choice depends on the type of race track. Certainly there are many other factors that can affect the motor choice too e.g. the weight of the car, the type of technical track, roller size, wheel size etc… From the result we got so far, the high speed green and pink 3.5:1 gear set seems to be the best for both speed and acceleration?
What does the result mean to fellow racers?
if you want the highest speed, go for the green and pink 3.5:1 gear set. If you want the highest acceleration, our result is not so conclusive so we can’t make any solid recommendation. But technically it should be the blue and orange 4:1 gear set.
What if you need a consistent performance? As large speed variance could be the reason why sometimes your car jumped over an obstacle and landed perfectly and sometimes it didn’t. If you need a more consistent performance, the high torque blue and orange 4:1 gear set should be the best option as it has the least speed variance during a run among the three. However our data shows that each run might be different.
This experiment is by no means conclusive. Your setup might be different from ours which would create different results. But we hope that it provides you an interesting insight to the subject matter.
What would you take away from this experiment? How would you improve it? Please feel free to leave a comment on our Facebook page @Mini4Science.
Annex A – Experiment results
3.5:1 gear set
1st Run
Here is a chart showing the speed of the car from the first run.

Top speed

The top speed of the car was 7.3 m/s. The Motor RPM was 18,690 (see green lines).
Average Speed

The average speed was around 6.56 m/s and Motor RPM was 16,794. (see blue line)
Acceleration

The acceleration was around 6.15 m/s2 .
2nd Run
Here is a chart showing the speed of the car from the second run.

The chart looks quite similar to the 1st run.
Top speed

The top speed of the car was 7.3 m/s. The Motor RPM was 18,690 (see green lines).
Average speed

The average speed was around 6.55 m/s and Motor RPM was 16,785. (see blue line)
Acceleration

The acceleration was around 6.04 m/s2 .
3rd Run
Here is a chart showing the speed of the car from the third run.

The chart looks quite similar to previous run.
Top speed

The top speed of the car was 7.38 m/s. The Motor RPM was 18,900 (see green lines).
Average speed

The average speed was around 6.59 m/s and Motor RPM was 16,885. (see blue line)
Acceleration

The acceleration was around 6.25 m/s2 .
3.7:1 gear set
1st Run
Here is a chart showing the speed of the car from the first run.

Top speed

The top speed of the car was 7.05 m/s. The Motor RPM was 18,920 (see green lines).
Average Speed

The average speed was around 6.41 m/s and Motor RPM was 17,187. (see blue line)
Acceleration

The acceleration was around 5.91 m/s2 .
2nd Run
Here is a chart showing the speed of the car from the second run.

The chart looks quite similar to the 1st run.
Top speed

The top speed of the car was 7.22 m/s. The Motor RPM was 19,360 (see green lines).
Average speed

The average speed was around 6.46 m/s and Motor RPM was 17,339. (see blue line)
Acceleration

The acceleration was around 5.73 m/s2 .
3rd Run
Here is a chart showing the speed of the car from the third run.

The chart looks quite similar to previous run.
Top speed

The top speed of the car was 7.13 m/s. The Motor RPM was 19,140 (see green lines).
Average speed

The average speed was around 6.46 m/s and Motor RPM was 17,325. (see blue line)
Acceleration

The acceleration was around 5.85 m/s2 .
4:1 gear set
1st Run
Here is a chart showing the speed of the car from the first run.

Top speed

The top speed of the car was 6.72 m/s. The Motor RPM was 19,680 (see green lines).
Average Speed

The average speed was around 6.08 m/s and Motor RPM was 17,799. (see blue line)
Acceleration

The acceleration was around 6 m/s2 .
2nd Run
Here is a chart showing the speed of the car from the second run.

The chart looks quite similar to the 1st run.
Top speed

The top speed of the car was 6.89 m/s. The Motor RPM was 20,160 (see green lines).
Average speed

The average speed was around 6.25 m/s and Motor RPM was 18,301. (see blue line)
Acceleration

The acceleration was around 6.23 m/s2 .
3rd Run
Here is a chart showing the speed of the car from the third run.

The chart looks quite similar to previous run.
Top speed

The top speed of the car was 6.81 m/s. The Motor RPM was 20,169 (see green lines).
Average speed

The average speed was around 6.23 m/s and Motor RPM was 18,473. (see blue line)
Acceleration

The acceleration was around 5.94 m/s2 .


![7 different Tamiya Mini 4WD low profile small diameter tyres [Item no: 95208, 95205,95152, 95281, 95304]](https://mini4science.com/wp-content/uploads/2024/09/IMG_0538_mod2-150x150.jpg)
![8 different Tamiya Mini 4WD metal rollers [Item no: 95612, 15522, 95643, 95497, 15426, 95160, 15345, 15475]](https://mini4science.com/wp-content/uploads/2024/07/IMG_0296-150x150.jpg)


![7 different Tamiya Mini 4WD low profile small diameter tyres [Item no: 95208, 95205,95152, 95281, 95304]](https://mini4science.com/wp-content/uploads/2024/09/IMG_0538_mod2.jpg)
![8 different Tamiya Mini 4WD metal rollers [Item no: 95612, 15522, 95643, 95497, 15426, 95160, 15345, 15475]](https://mini4science.com/wp-content/uploads/2024/07/IMG_0296-scaled.jpg)

