First published 23 November 2022. Last updated 7 December 2022.
Introduction
Tamiya Hyper-Dash motor is one of the most popular motors amongst Mini 4WD racers. It’s been around since the early days of Mini 4WD. Back in the days, it had a black metal body and a red endbell cap. The Hyper-Dash motor has great speed and acceleration. It is faster than the Atomic Tuned motor. It was the fastest Tamiya Mini4WD motor until the newer and faster motors such as the Ultra Dash, Power Dash and Plasma Dash came along. It is quite a handful for technical tracks. With the introduction of Tamiya Mini 4WD pro, Tamiya introduced the double shafted version of the motor and called it the Hyper-Dash PRO.
How fast is the Hyper-Dash PRO motor? What is the top speed? How quickly can it accelerate a Mini4WD to the top speed? Let's find out.
Please note, this is a working document so it will get updated regularly in the next few days.
Estimating top speed and acceleration
As discussed the previous article (What is the performance of the Tamiya Atomic Tuned 2 Motor Pro), we can estimate the top speed and acceleration of the motor based on what is written on the back of the packaging. So let’s take a look at the packaging.
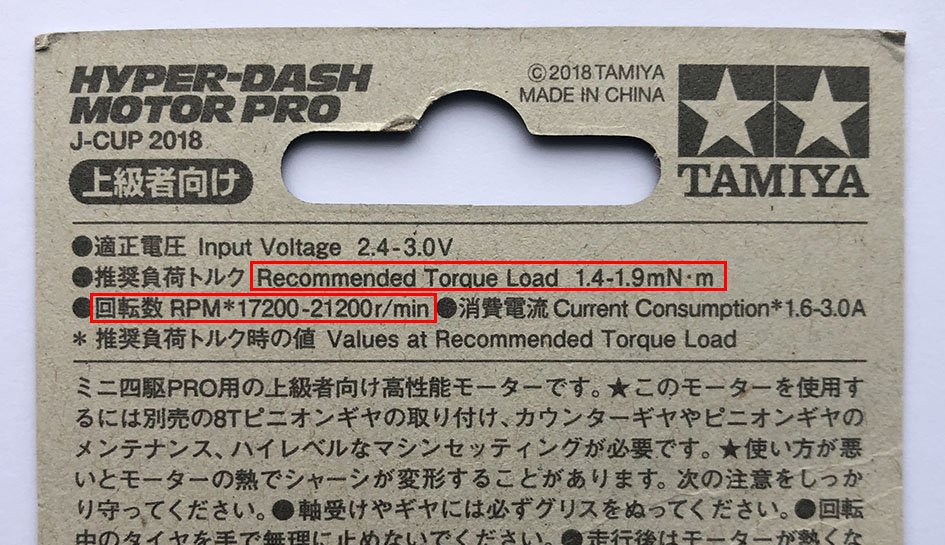
From the packaging, we can see that the motor has an RPM range of 17,200 to 21,200 and torque between 1.4 and 1.9mNm.
We know:
Speed (in metre per second) = Motor RPM / gear ratio / 60 × Diameter of the wheel (in metre) × Pi
Acceleration (in m/s2) = Torque of motor (Nm) × gear ratio / diameter of wheel (in centimetres) × 100 × 2 / mass (kg)
To calculate, we need a few more pieces of information:
Gear ratio: 4:1
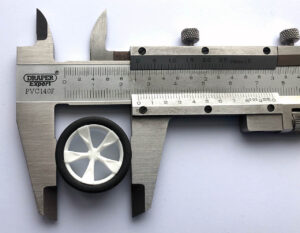
Diameter of the wheel: 2.61cm (0.0261m)
Mass: 160g (0.16kg)
Estimated top speed:
Low) 17,200 / 4 / 60 × 0.0261 × PI = 5.87 m/s
High) 21,200 / 4 / 60 × 0.0261 × PI = 7.24 m/s
Estimated acceleration is:
Low) 1.4 / 1000 × 4 / 2.61 × 100 × 2 / 0.16 = 2.68 m/s2
High) 1.9 / 1000 × 4 / 2.61 × 100 × 2 / 0.16 = 3.64 m/s2
So the estimated top speed is around 5.87 to 7.24 m/s and the acceleration is around 2.68 to 3.64 m/s2. So how true are these estimates? Let’s find out.
Test track
We are going to need a long enough track, preferably a Tamiya one, to test the motor. Luckily there was a Mini 4WD Grand Prix in Gloucester, UK organised by Mini 4WD UK on 12th November 2022. Thanks to the generosity of the organisers and the patience of fellow Mini 4WD racers, we were able to run some tests.
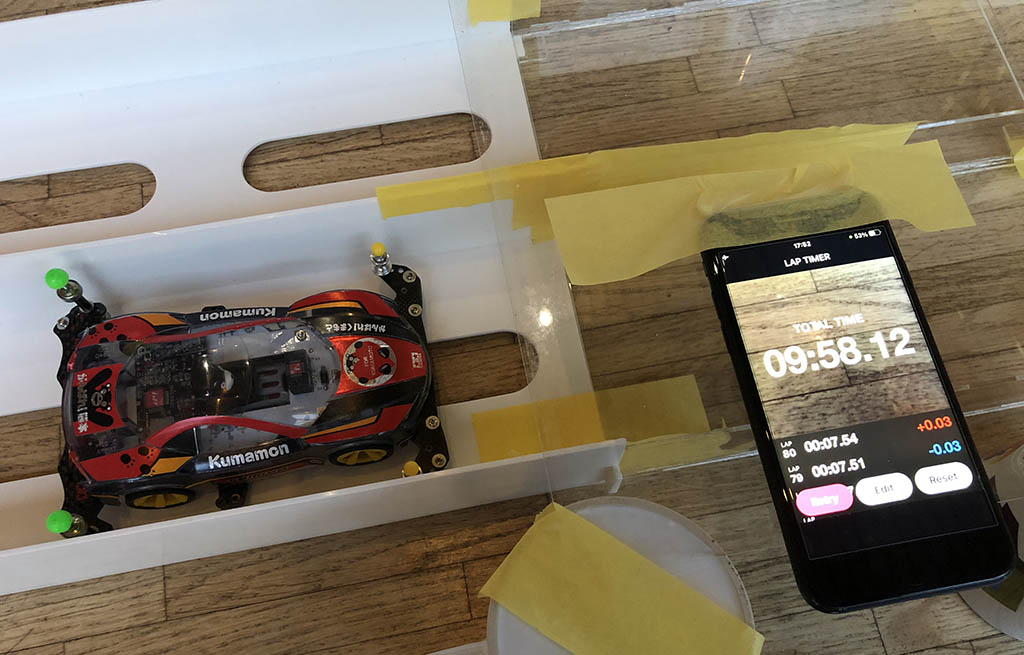
Test equipment
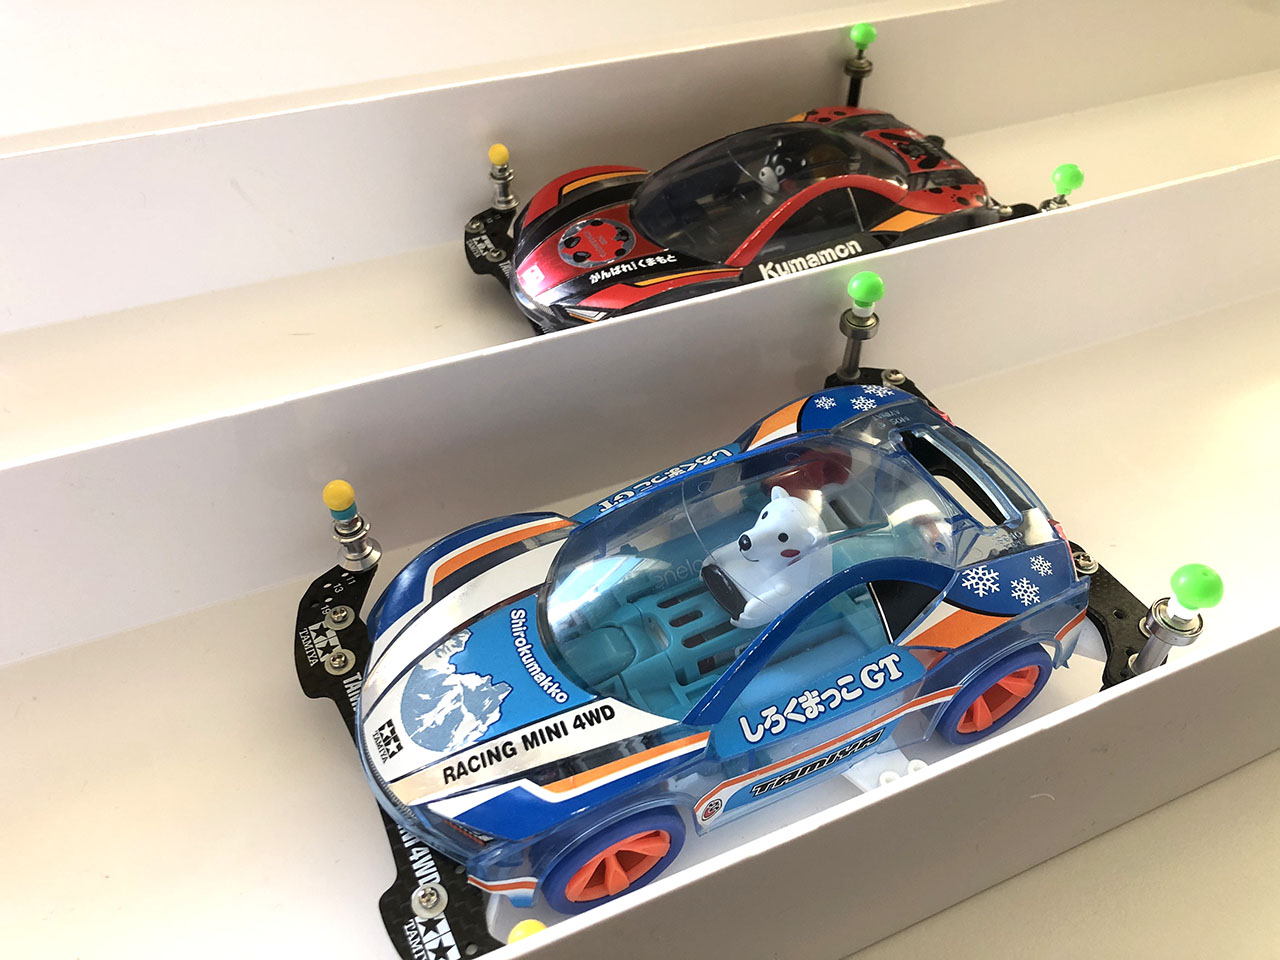
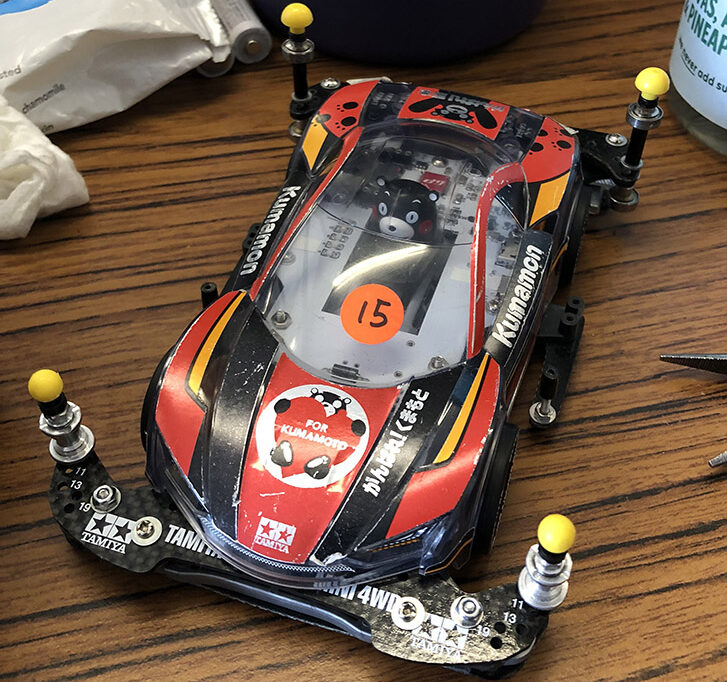
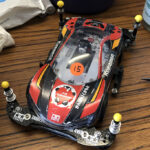
Car: Tamiya 95281 Kumamon MINI 4WD (image source Tamiya Blog)
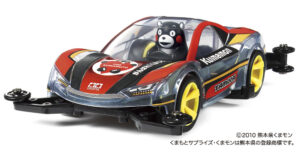
Chassis: MA Chassis
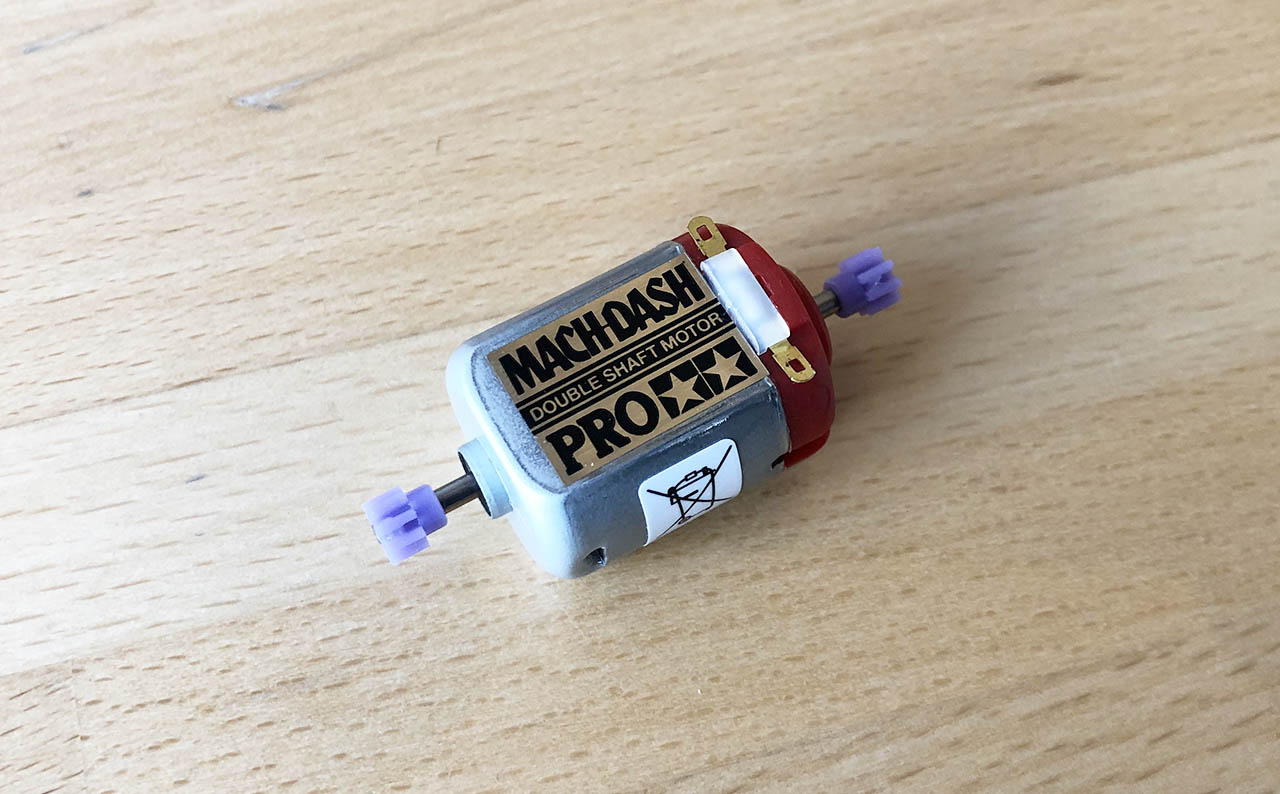
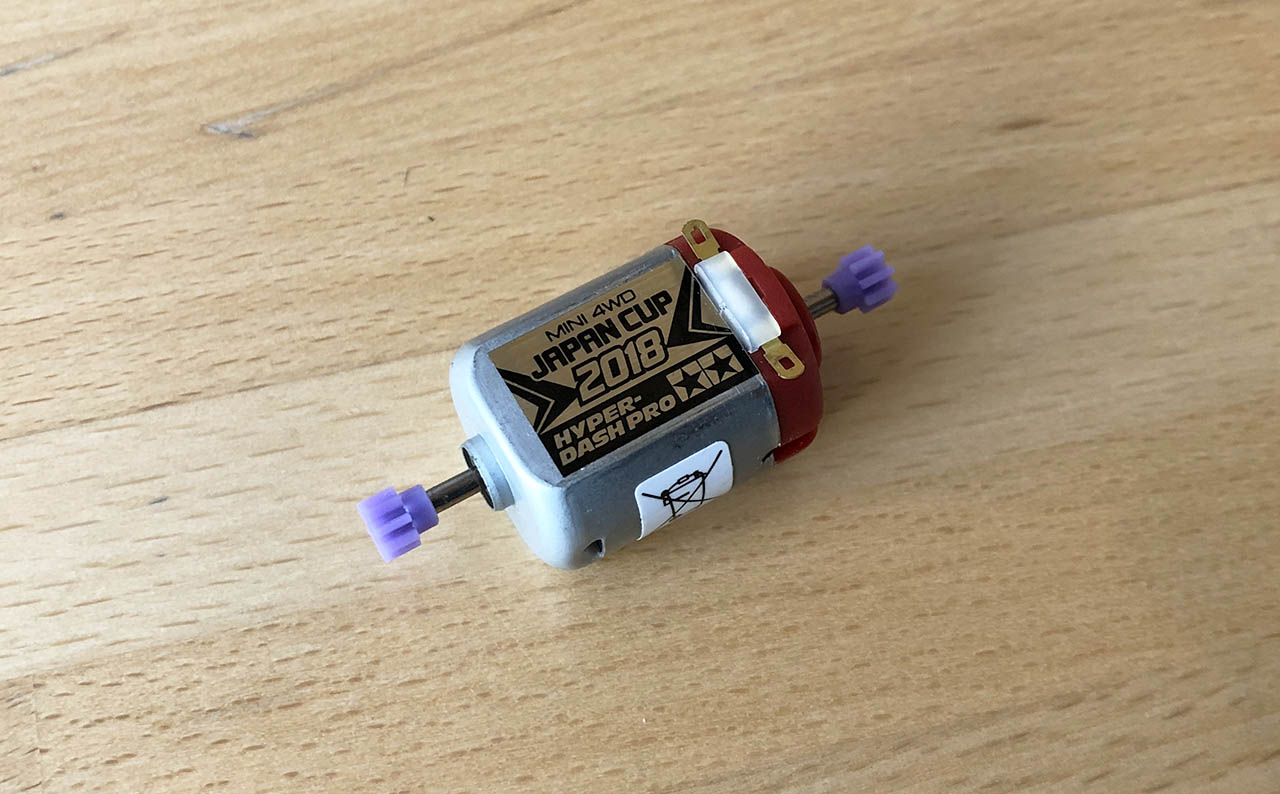
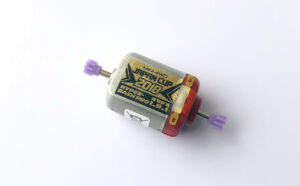
Motor: Tamiya Hyper-Dash PRO Japan Cup 2018
Gear Ratio: 4:1 (blue and orange)
Wheel Diameter including tyres: 2.61 cm
Battery: Tamiya Neo Champ 950mAh rechargeable batteries

Mass: 160 grams
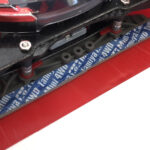
Telematics:
- Adafruit Feather M0 Basic Proto - ATSAMD21 Cortex M0 48Mhz processor (Arduino Zero) to run the measuring program.
- 6-axis gyroscope and accelerometer (MPU6050) to measure acceleration and rotation
- A clock to measure time in milliseconds
- A tachometer to measure distance in centimetres.
- on-board data storage (Adafruit SPI Flash SD Card 512MB) to store the data recorded.

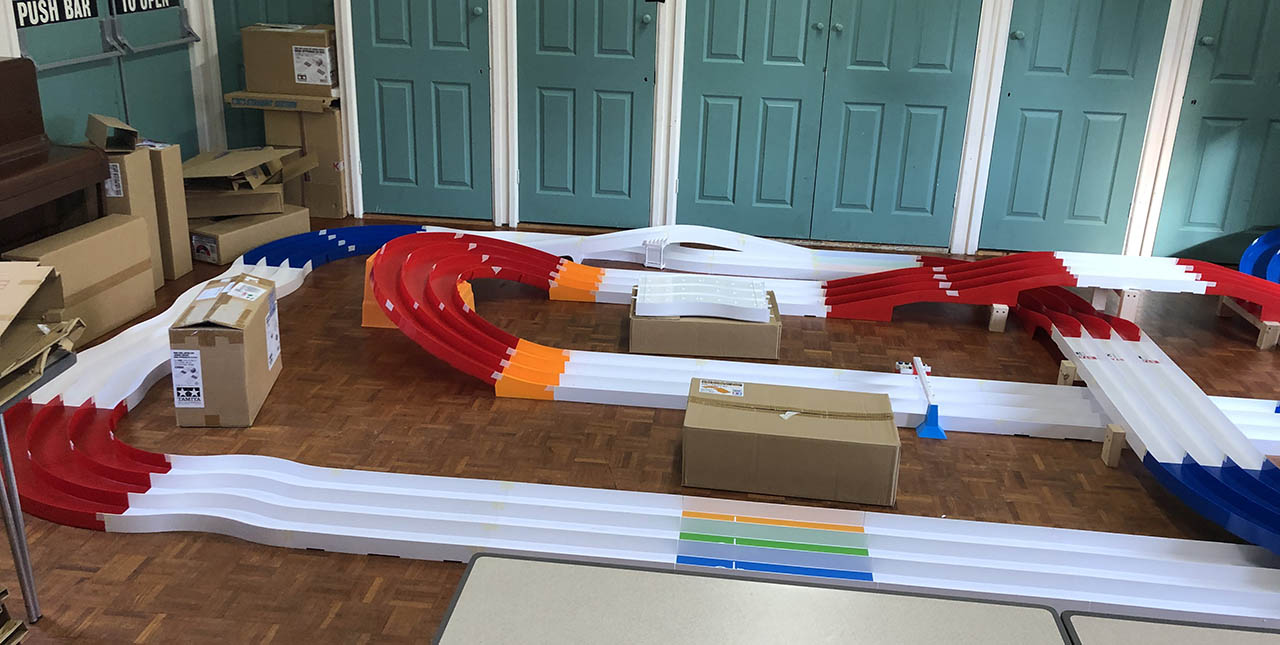
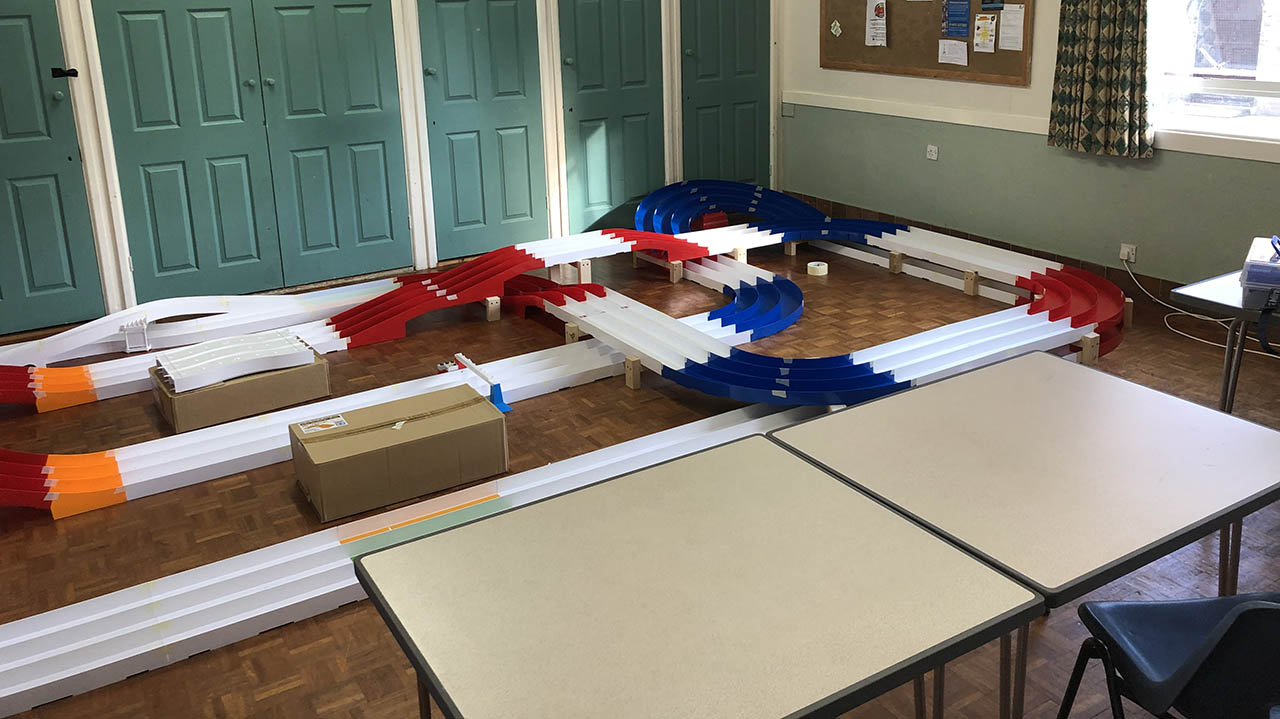
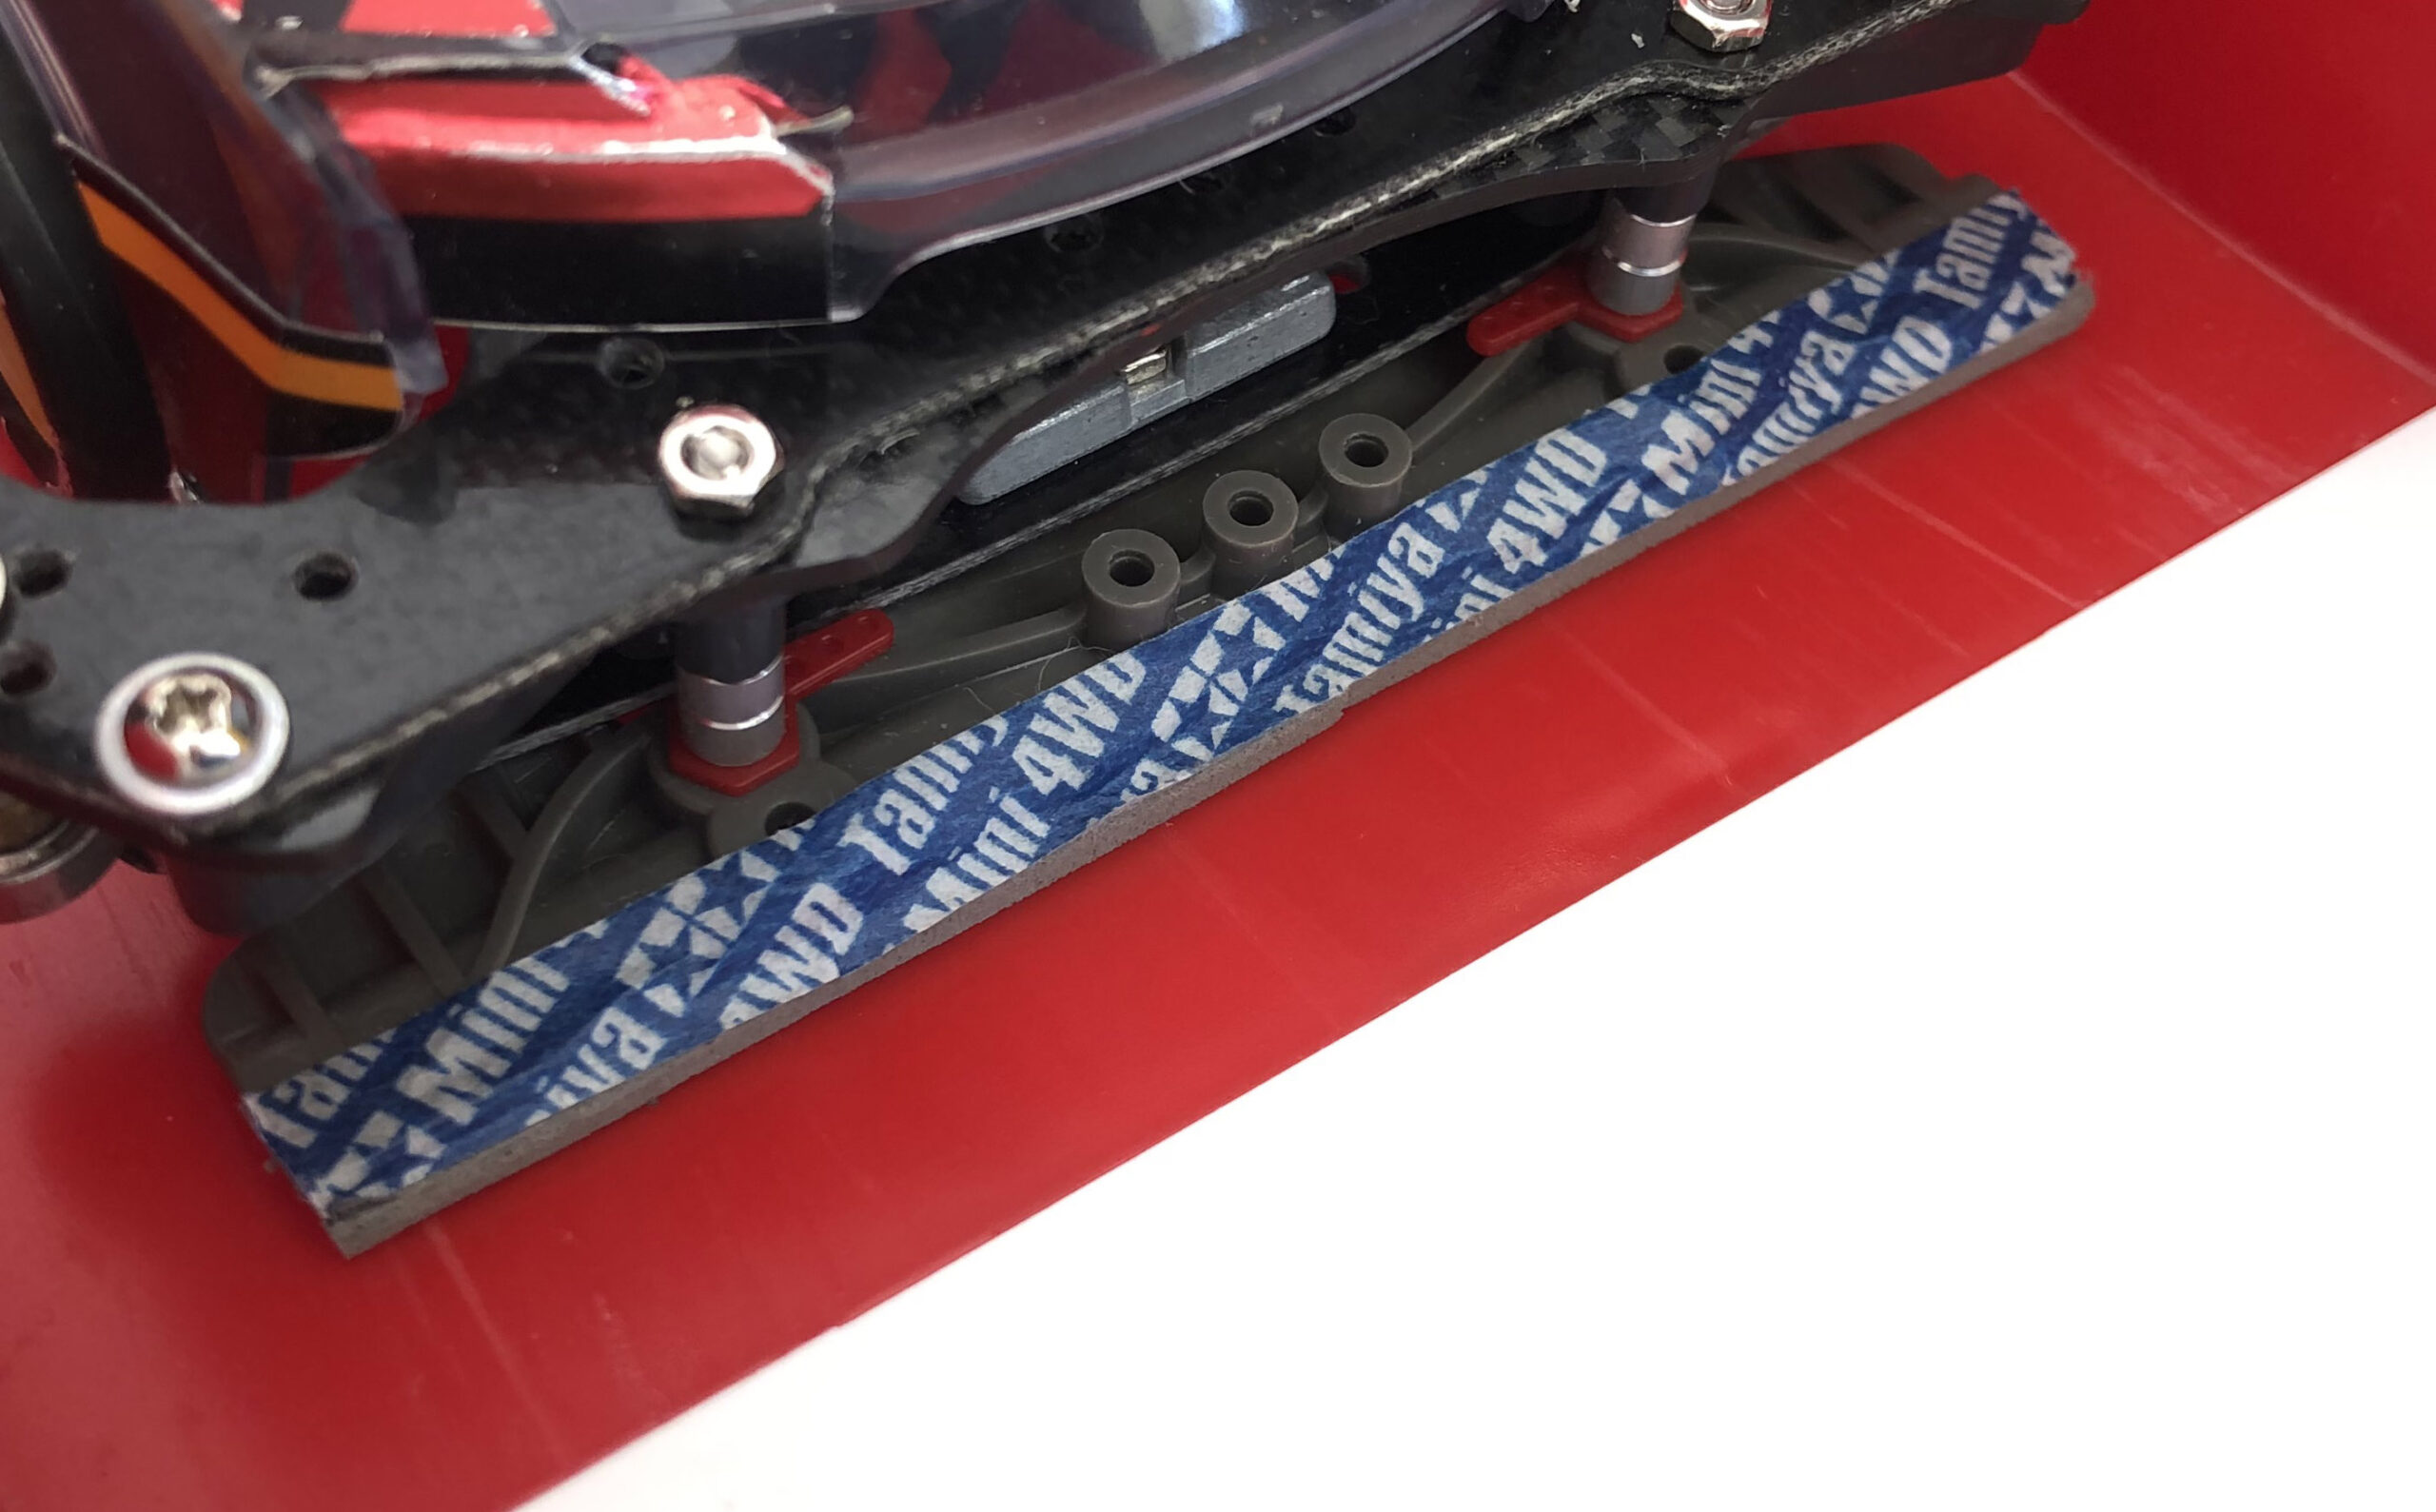
Test methods
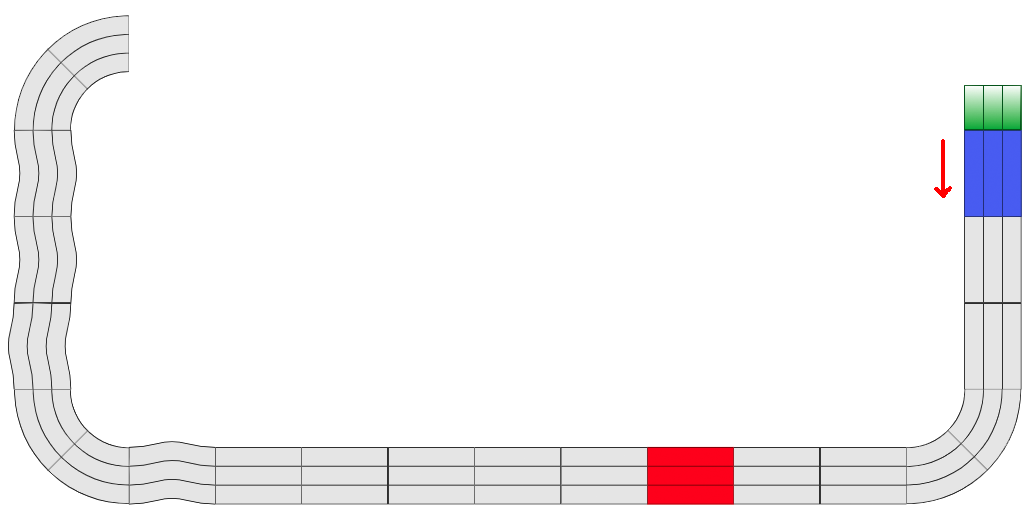
The plan was to run the car around the longest straight using the outside lane e.g. (A) From the track part in blue all the way to the 90 degree corner on the top left. For checking, I also did a second run (B) from the track part in red all the way to the 90 degree corner on the top left. This report will focus on (A).
The on-board computer captures readings (accelerometer, gyroscope, tachometer and time) every 10 milliseconds (0.01 seconds or 100 times a second) and stores each lines in the on-board storage in a CSV file format, which I can later download to the laptop for analysis after each run.
The data will enable us to calculate speed and acceleration. The on-board gyroscope, accelerometer and tachometer will help us determine the position of the car e.g. in a straight, in corner or in the wave section.
Certainly it would be ideal to repeat the tests multiple times with full charge batteries, so that we can aggregate the results and get a more accurate picture. I was only able to run this particular test only once as I didn’t want to disturb follow racers from practicing and testing during breaks and I had other tests I would like to conduct too. It was great to be able to do this experiment and we can always find another opportunity to do this again.
Calibration
As with many scientific experiments, one should calibrate the measuring equipment before conducting the experiment in order to produce a more accurate result. I didn't manage to calibrate the measuring equipment before the experiment day. A few weeks later, I took the opportunity to check the accuracy of the tachometer and the clock on the test car.
Tachometer accuracy test:
I used my desk to measure the accuracy of the tachometer. I measured the length of my desk, it is 120.2cm long. I measured the length of the Mini 4WD test car, it is 15cm long. If I manually and steadily move the test car from one end of the desk (rear bumper at the end) to the other (front bumper at the end), at a steady speed as much as I can and going as straight as possible, the car should have moved 120.2cm - 15cm = 105.2cm. So I ran this test three times and checked the readings from the tachometer. Here are the results from the three runs.
- 104.95
- 104.54
- 104.54
Average: 104.68 cm, error rate: ~0.4%. That's not bad at all. I probably didn't line up the car perfect enough.
Clock accuracy test:
I tested the clock against a stop watch. To test the clock on the test car, I setup the test car to blink the on-board LED status light every 5 seconds. I used a stop watch to time the interval manually. I ran the test for about 35 seconds and here is the result:
- 00:00:05.136
- 00:00:04.891
- 00:00:05.040
- 00:00:05.062
- 00:00:05.098
- 00:00:04.945
Average: ~5.029 seconds, error rate ~0.6%. That's not bad at all. My reaction time probably caused the error.
So from the two tests, the tachometer and the clock on-board are pretty accurate with very low error rate.
Hypothesis
The measured motor top speed (RPM) and the motor torque should be within range of what Tamiya listed on the packaging - RPM between 17,200 and 21,200 and torque between 1.4 and 1.9mNm.
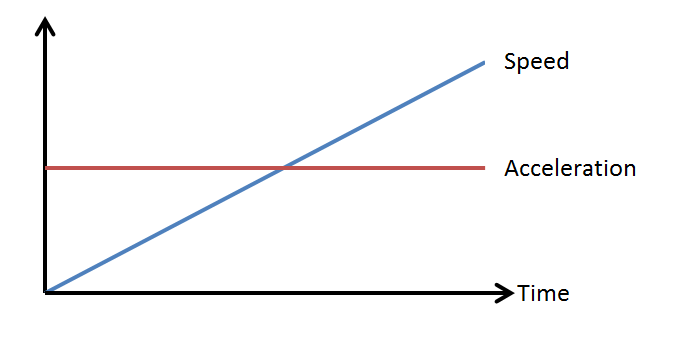
As the torque of an electric motor is often believe to be constant, we would expect the speed of our Mini 4WD to increase linearly similar to the chart below.
Considerations
Resistive forces such as air friction, mechanical friction and tyre friction can affect the outcome. The condition of my batteries e.g. charged voltage and internal resistance, motor condition e.g. run-in or worn out and electrical resistance in the circuit can also affect the outcome. I assume Tamiya included this in the value range. Tyre skid can be an issue too as the tachometer will read the wheel turning motion even the car is not moving forward. We should be able to detect that from the data collected.
The result
I downloaded the data from the on-board computer, imported the CSV files into Excel and plotted a chart with distance (cm) and time (ms). Here is the result we got from the first measurement (A).
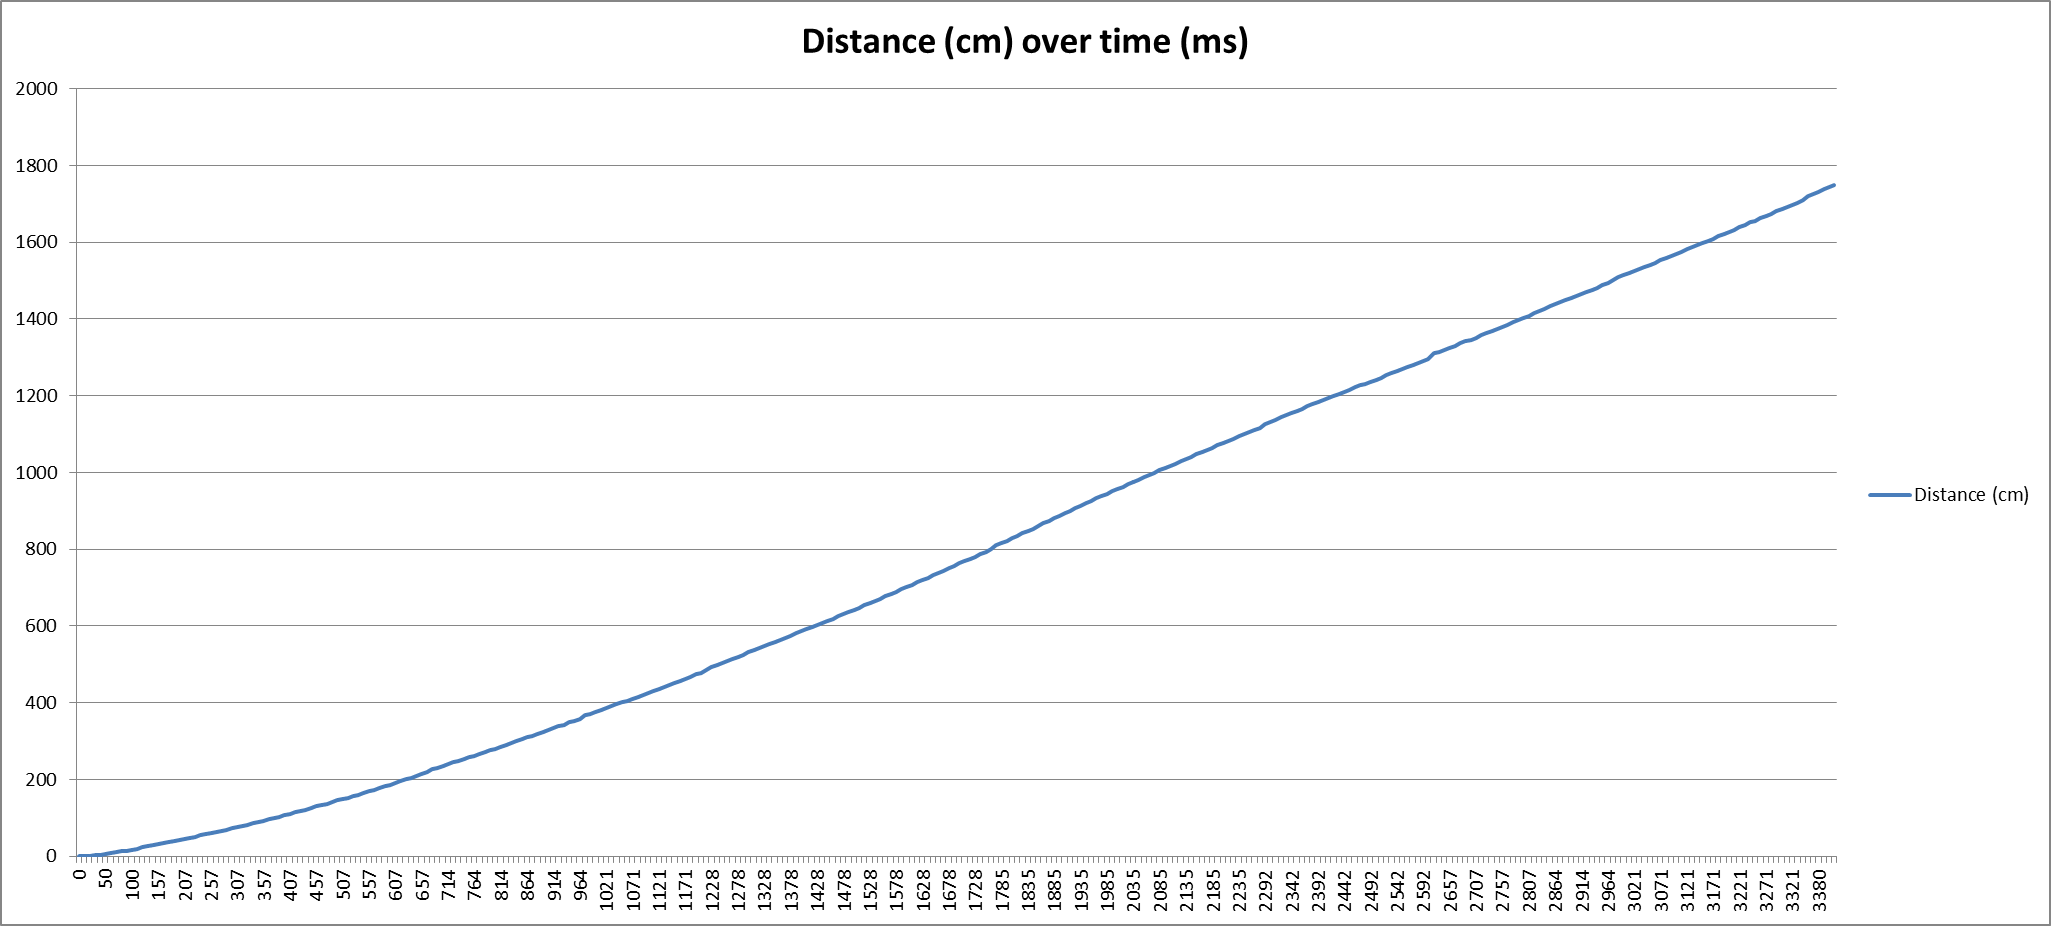
It is showing a slope. We can observe that the slope was less steep at the beginning and then it reaches quite a steady gradient which implies a constant speed. The line is quite smooth. There is a little bump at around 1300cm mark. But not a lot we can make sense of it at the moment.
Now let's calculate the speed of the Mini 4WD (in m/s) based on the distance (cm) and time (ms) measurements and plot them on a new chart. To reduce noise, a weighted average of 0.5 has been applied to the calculation.
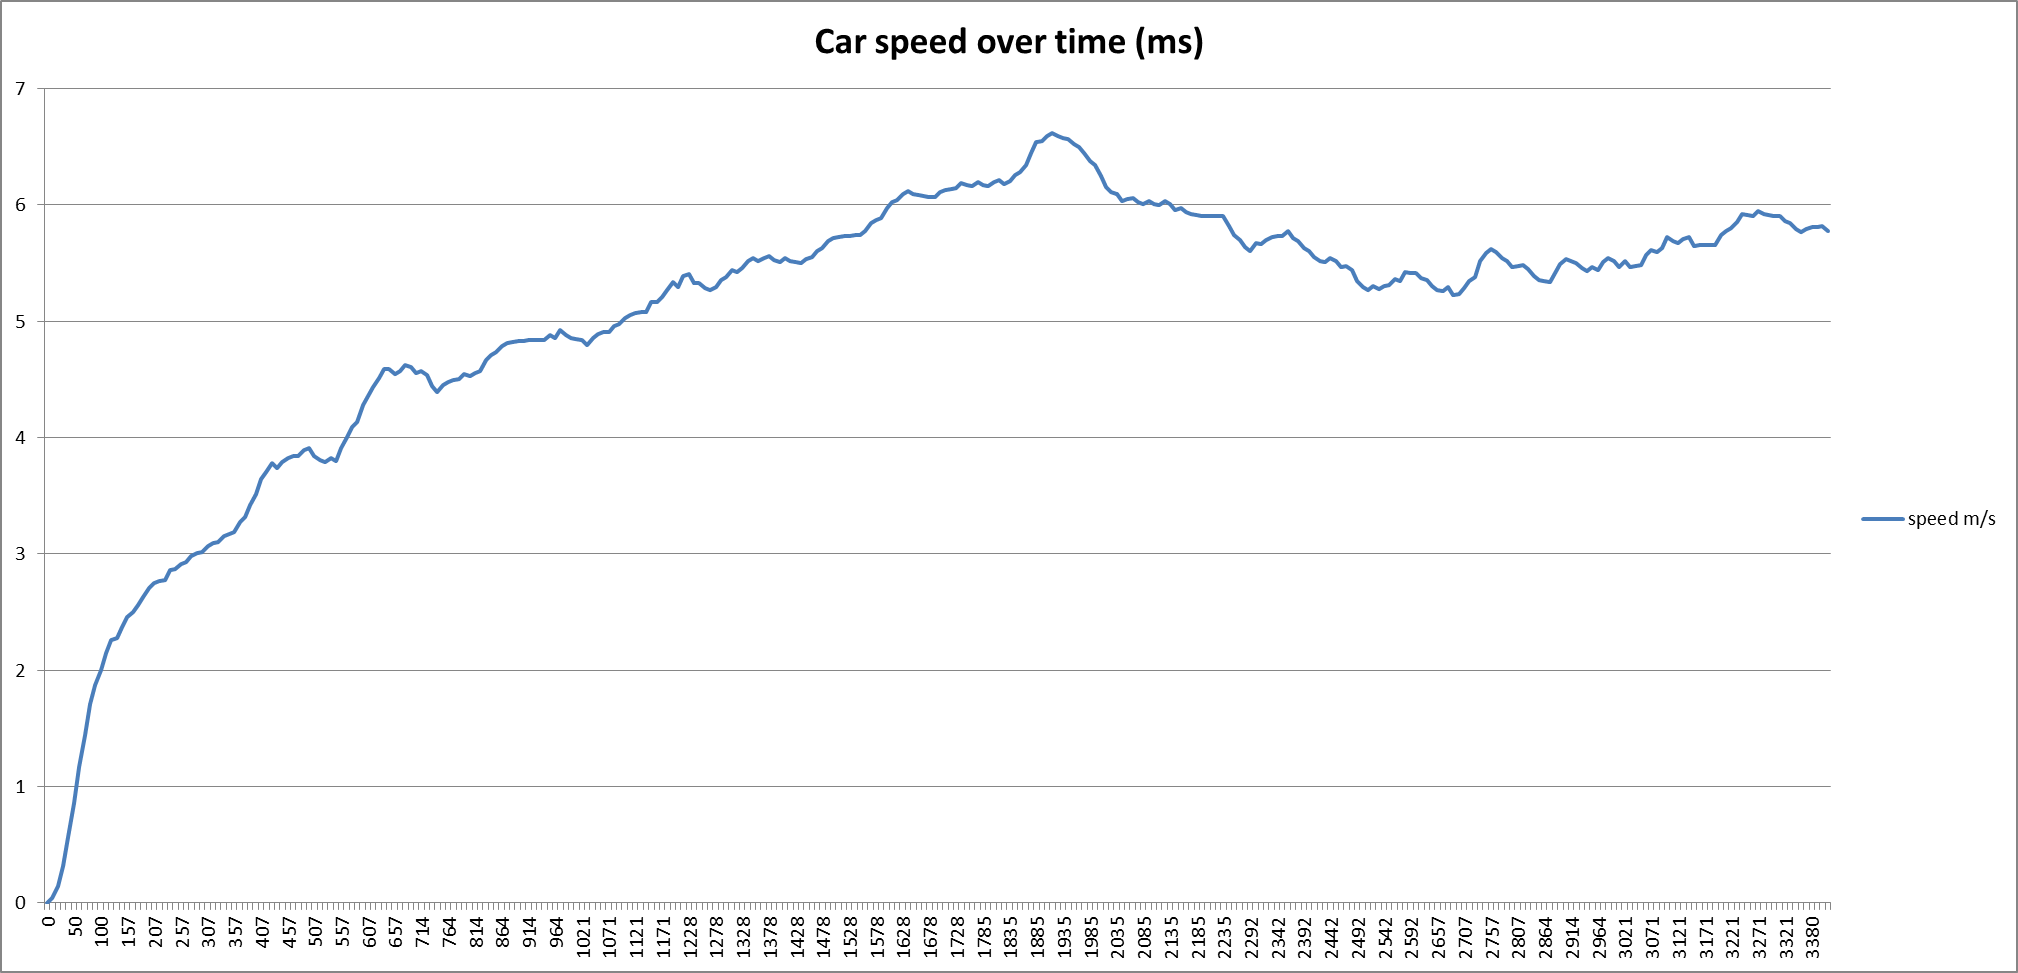
Now we can see some interesting features.
The outcome is not what we initially expected. It is more of a curve than a line.
The top speed from the measurement was 6.62 m/s. It took the car around 1.9 seconds to accelerate from a standstill and travelled around 9 metres (899.9cm). The top speed is in range with what we estimated based on the information on the packaging (5.87 to 7.23 m/s). Not bad at all. Well done Tamiya!
From the chart it seems like the motor pushed the car the strongest from standstill and the acceleration decreased as the speed built up until it gradually flattened and even dropped!
So what caused the dropped? Let’s overlay the accelerometer data and see whether we can get some answers:
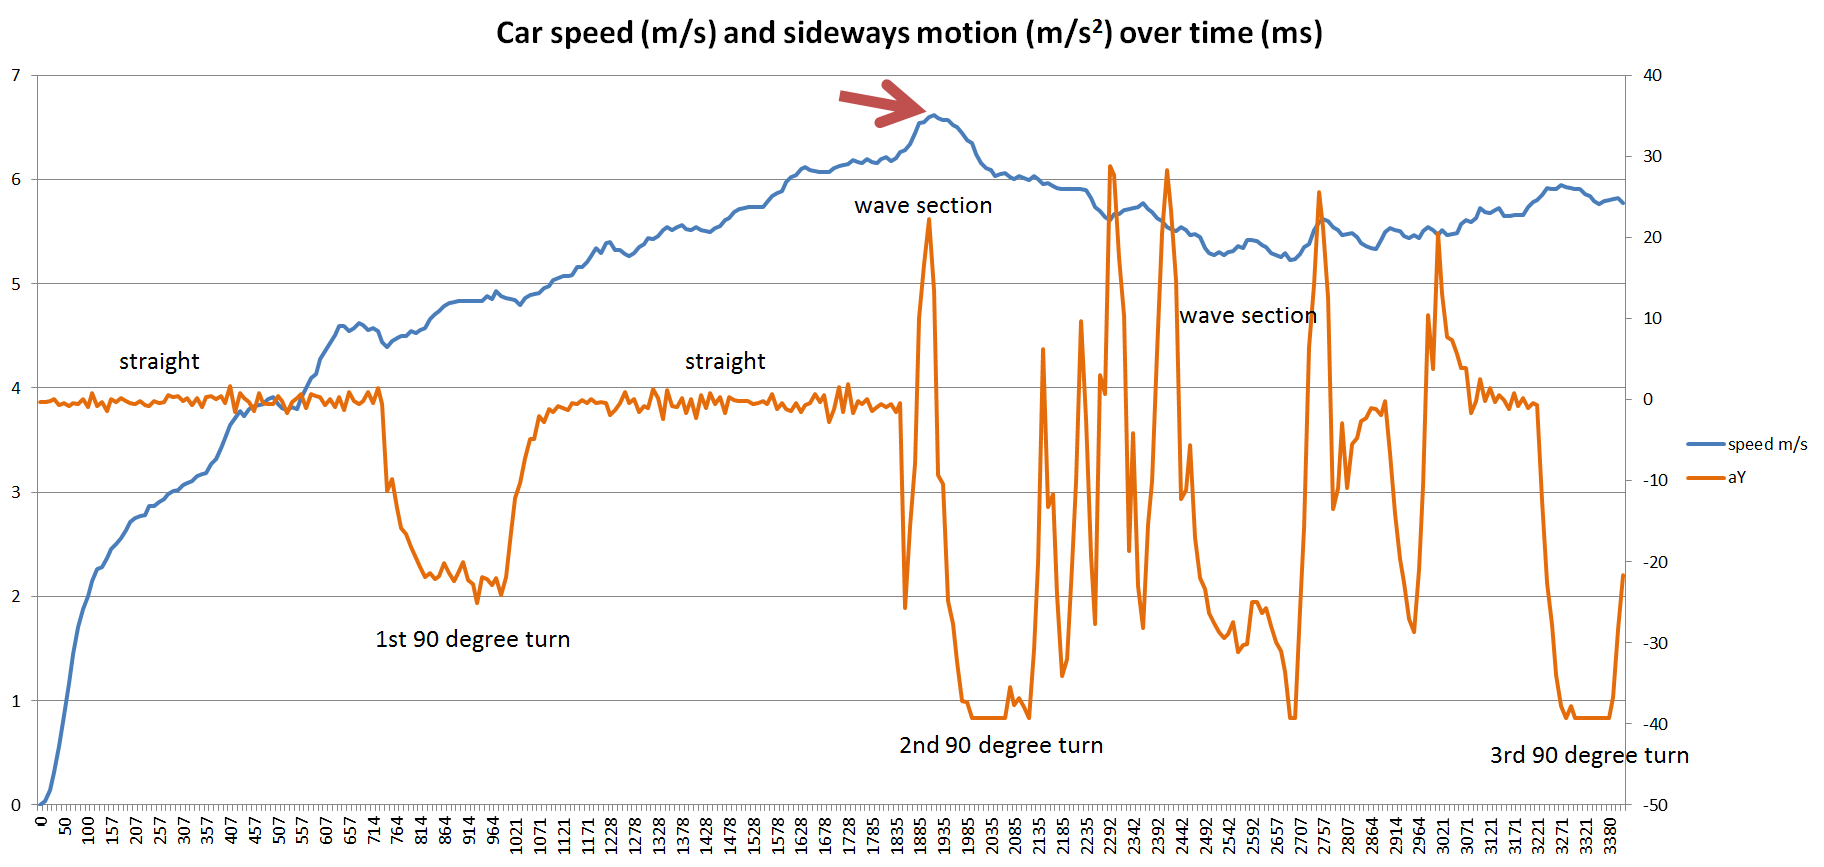
Left vertical axis is speed and right vertical axis is sideways acceleration.
I have labelled the section of the track from the accelerometer data. It seems like the 1st turn didn’t cause the car to slow down too much. But the combination of a wave section, a turn, followed by 3 consecutive wave sections did slow down the car. It would be interesting to find out why this happened in future experiments.
1g (gravitational acceleration) is around 9.81 m/s2. So the car is pulling ~4g around a bend and ~7g around the wave sections. That’s a lot of gs!
Zoom in and explore
Let’s keep it simple and focus on the data from the start to the top speed mark.
Speed Curve
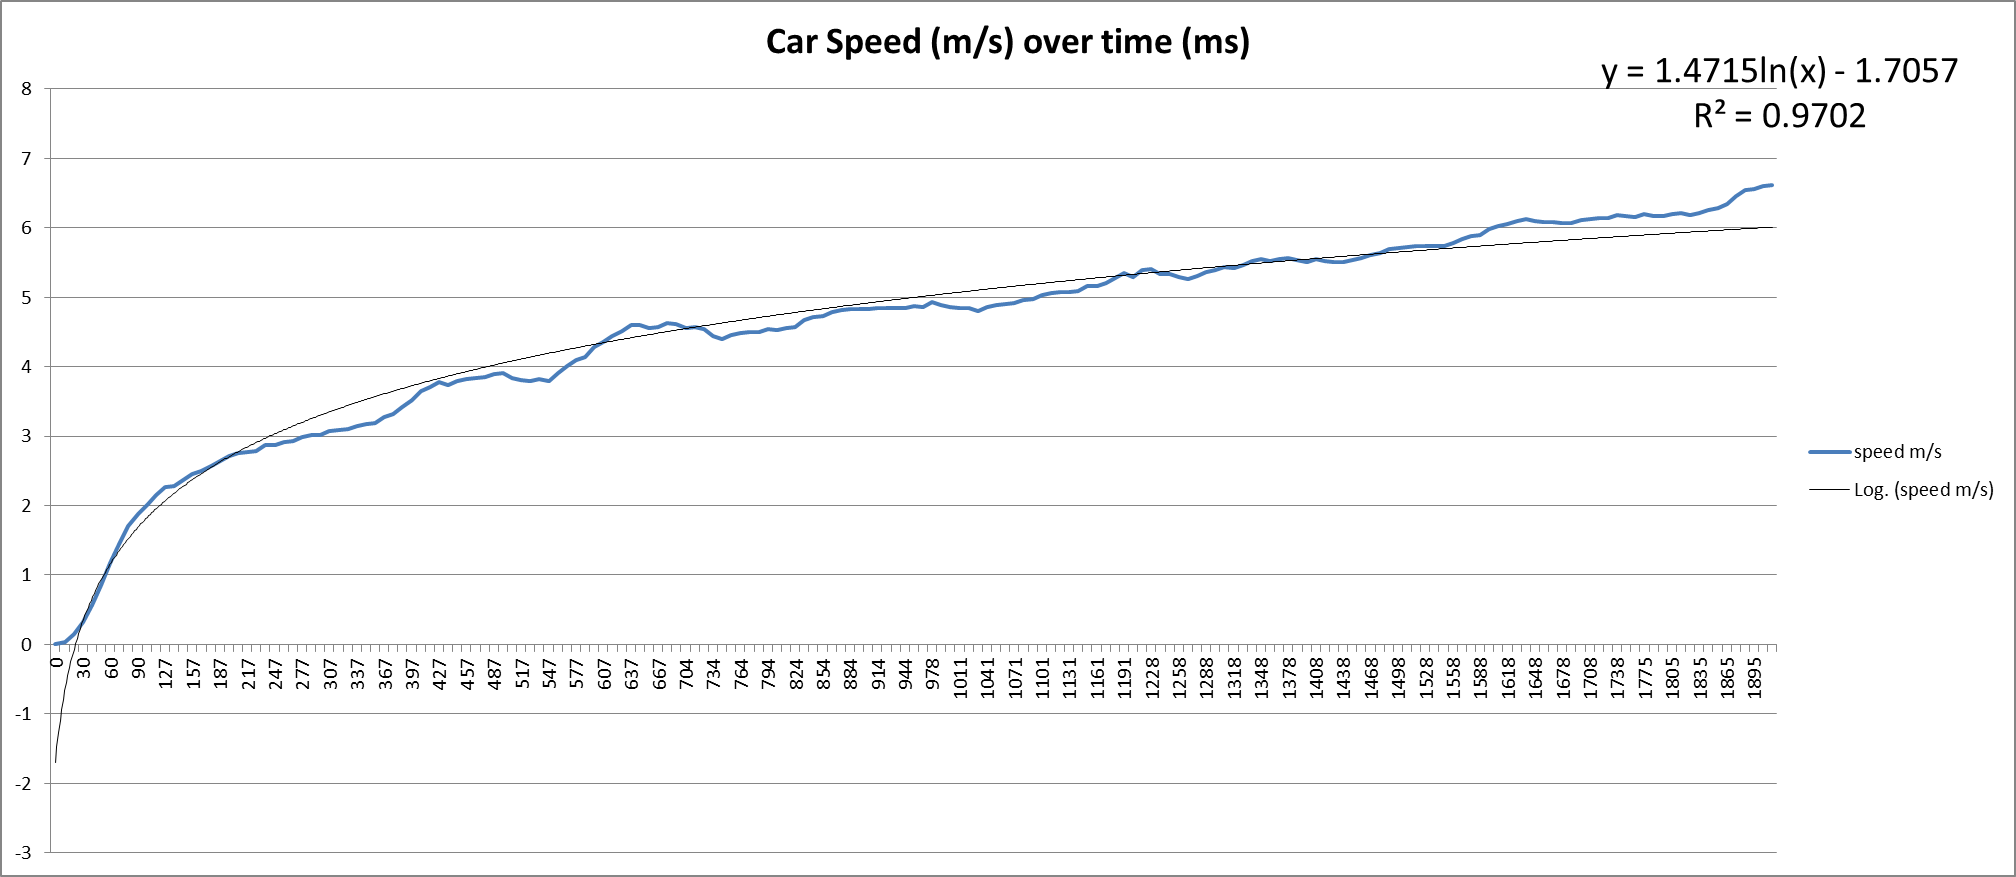
The shape of the speed curve seems to look like a logarithmic curve. So I applied regression with a logarithmic curve and see how well it fits (black line). It fits with R2 of 0.97, which means a statistically good fit. (If you are interested to learn about regression, please follow this link here).
Acceleration curve
From the chart above, we can determine the acceleration by calculating the gradient of the curve at certain point (e.g. the orange line).
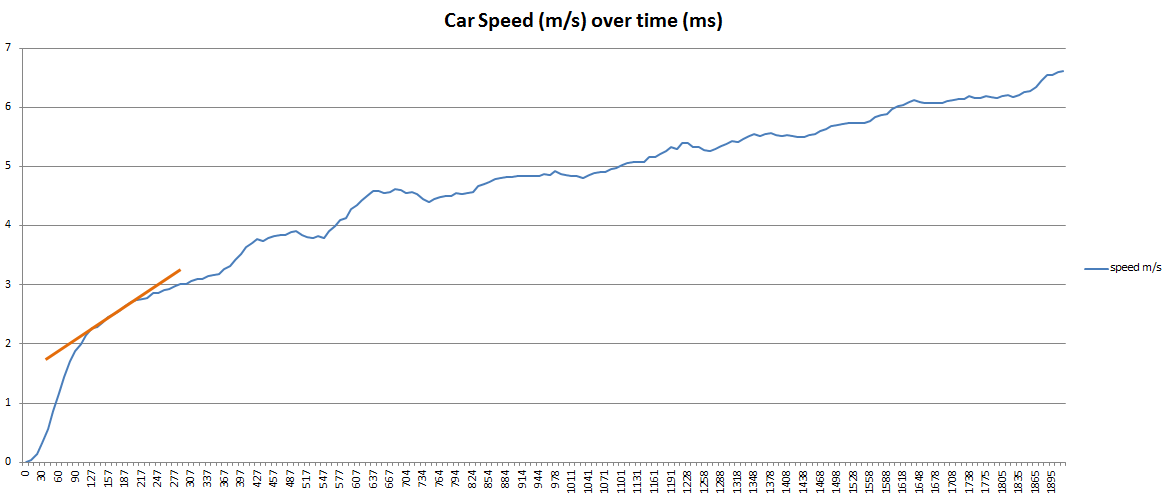
Let’s calculate the acceleration:
For example, we take a pair of speed reading:
S1 = 4.86 m/s
S2 = 4.89 m/s
Time between S1 and S2 is 0.01 seconds
Gradient at that point is: (S2 – S1) / time = (4.89 – 4.86) / 0.01 = 3
So acceleration at that point is 3 m/s2
Now we do the same for all the speed values we recorded. We can then plot the values and get a chart with acceleration (m/s2) over time (milliseconds).
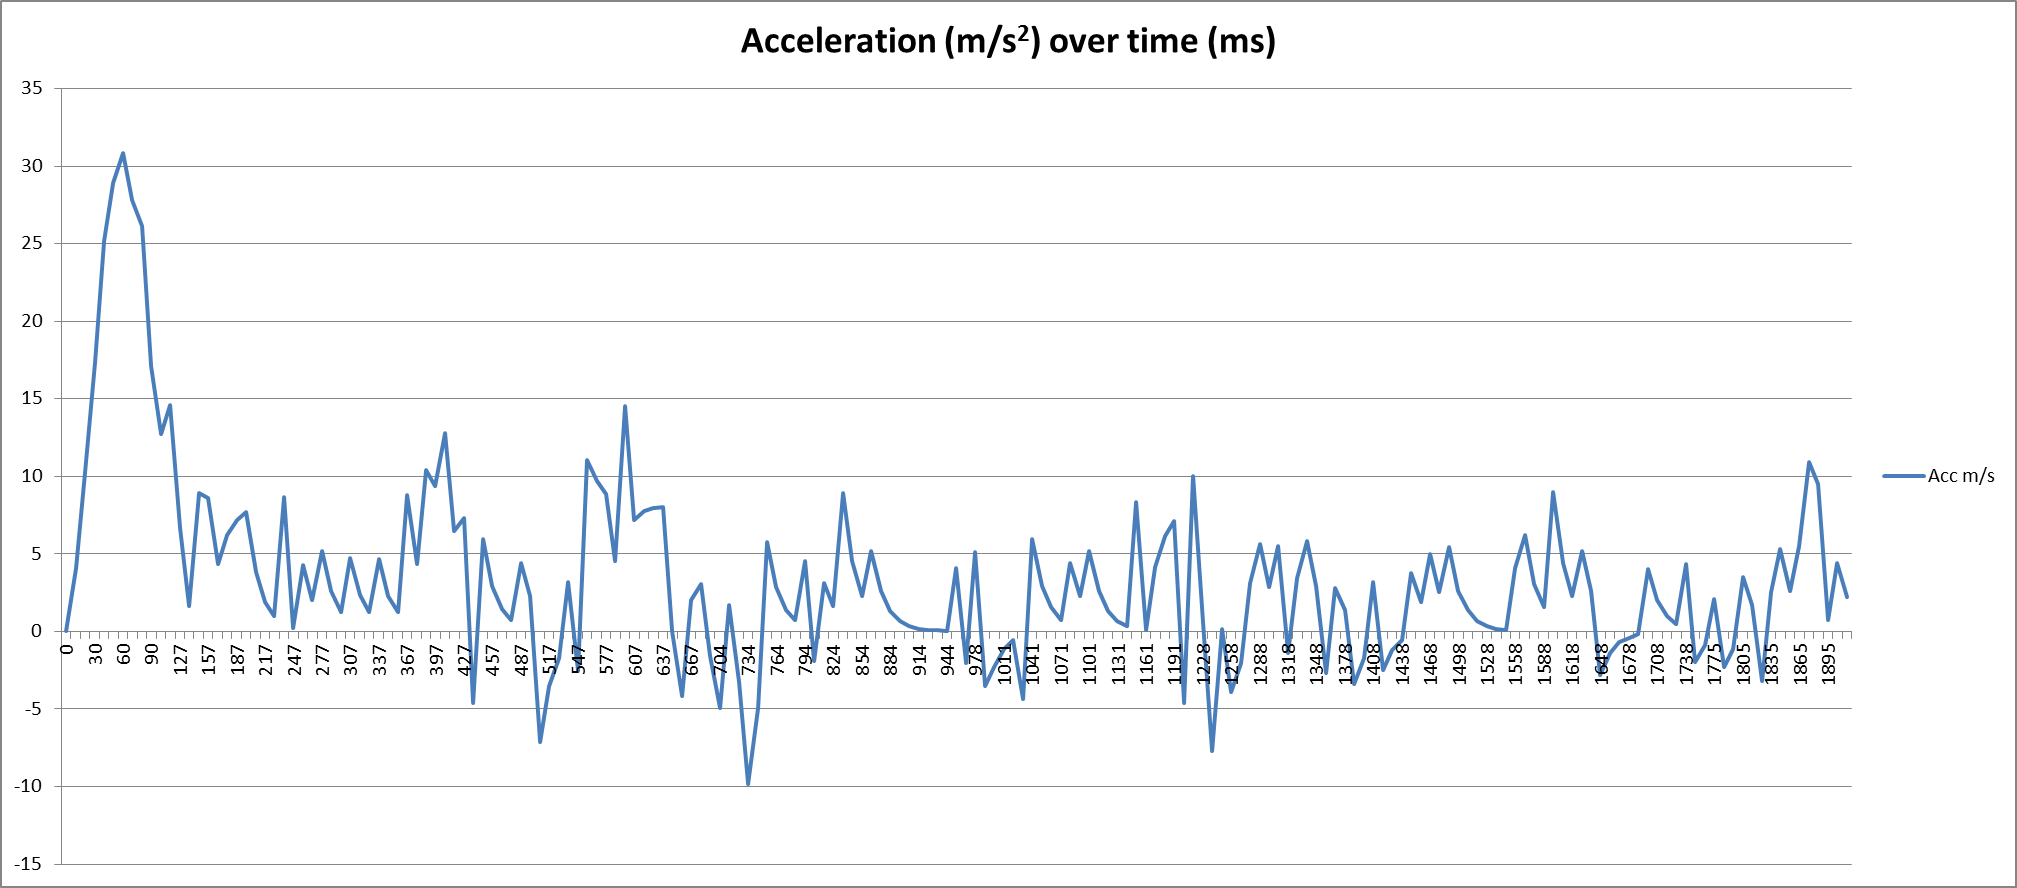
Alternatively if you have the equation of a curve, you can use differentiation in calculus to calculate the gradient. The total area under the curve is the distance that the car travelled. You can also use integration in calculus to calculate this. More about calculus here: https://www.britannica.com/science/calculus-mathematics
Torque Curve
If we can calculate the acceleration values, we can also calculate the torque value with our formula:
Acceleration (in m/s2) = Torque of motor (Nm) × gear ratio / diameter of wheel (in centimetres) × 100 × 2 / mass (kg)
So: Torque of motor (mNm) = Acceleration (in m/s2) / gear ratio × diameter of wheel (in centimetres) / 100 / 2 × mass(kg) × 1000
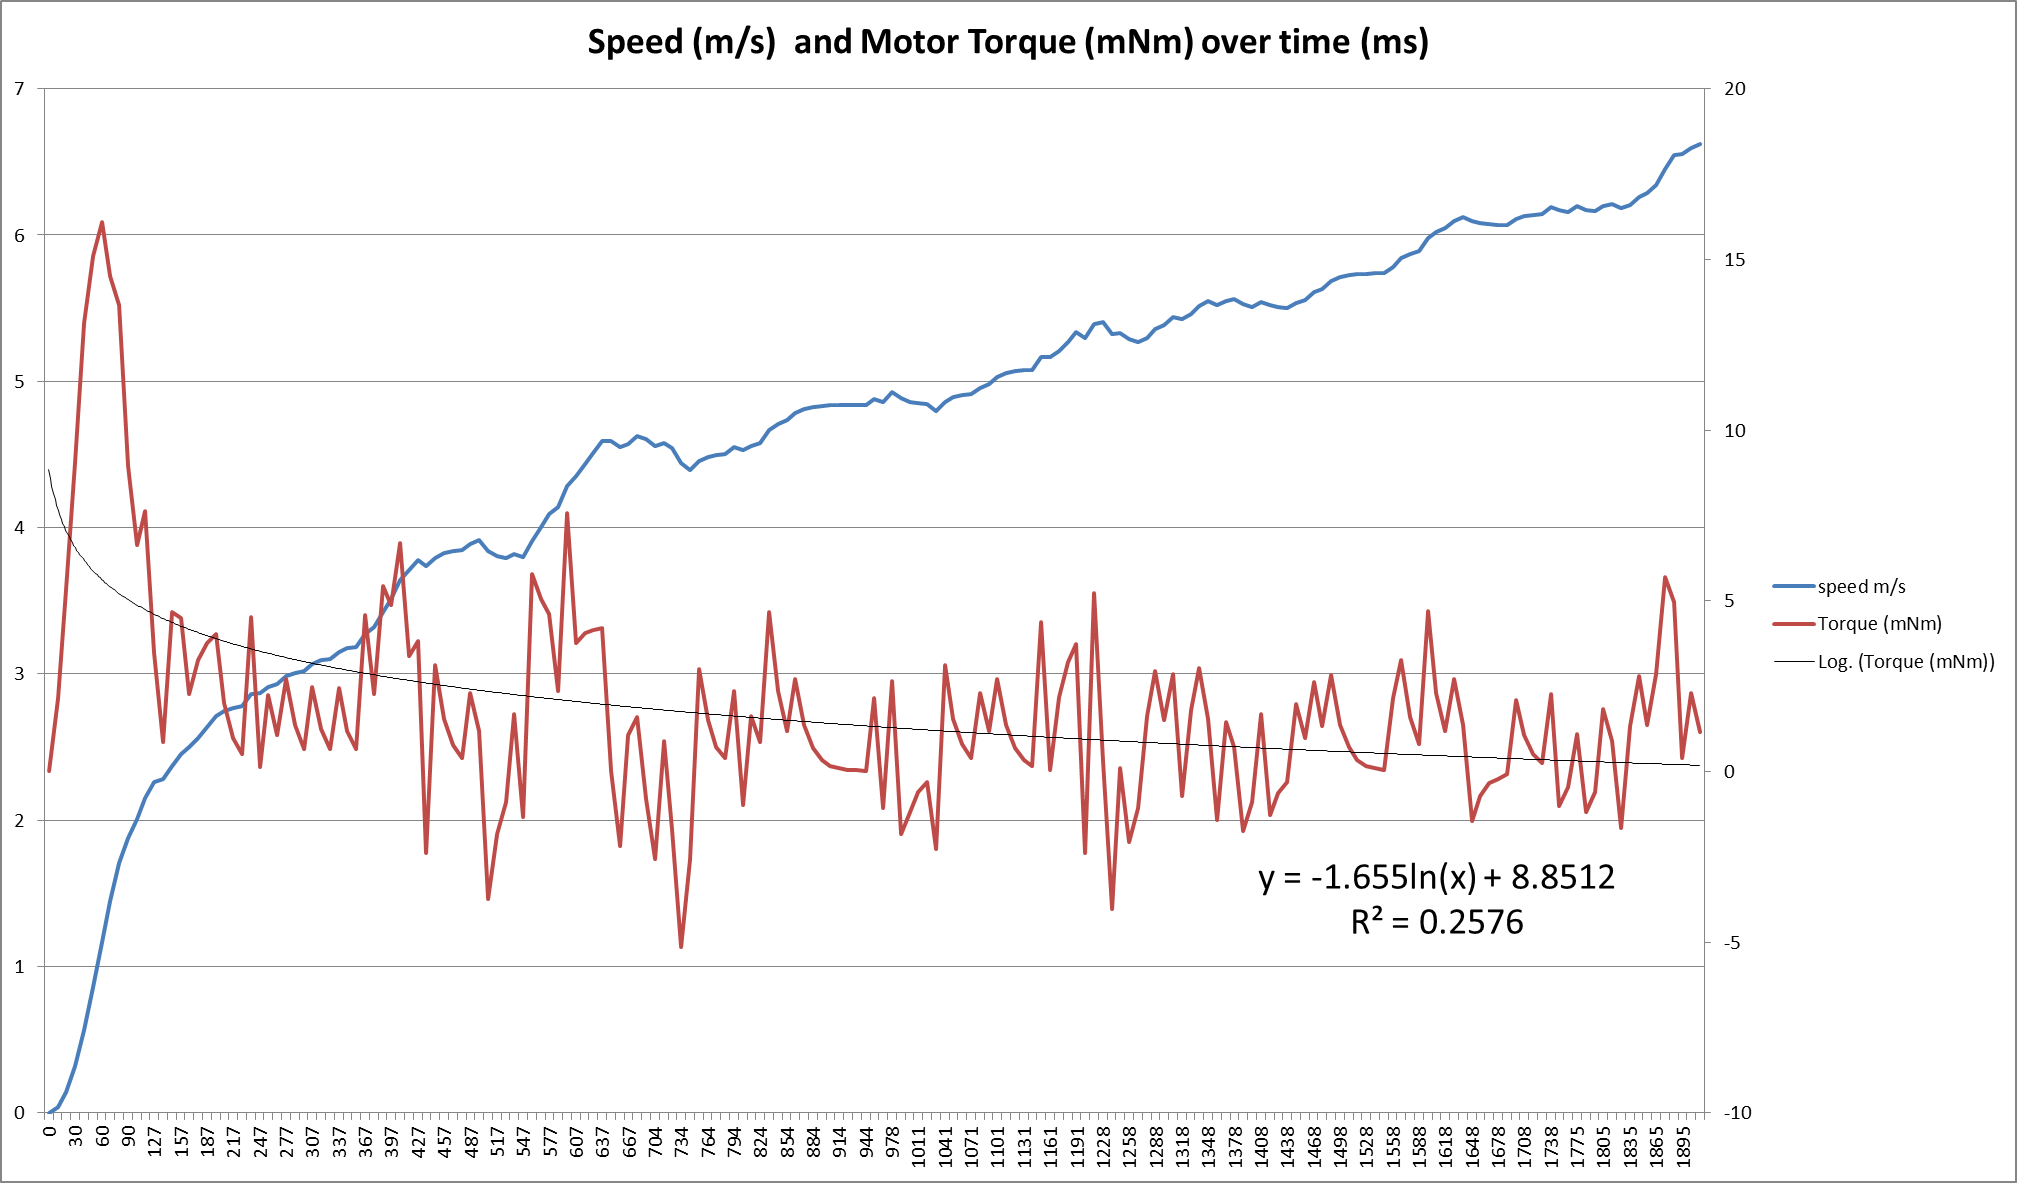
Now we plot the values and we get a chart with motor torque (mNm) over time (ms).
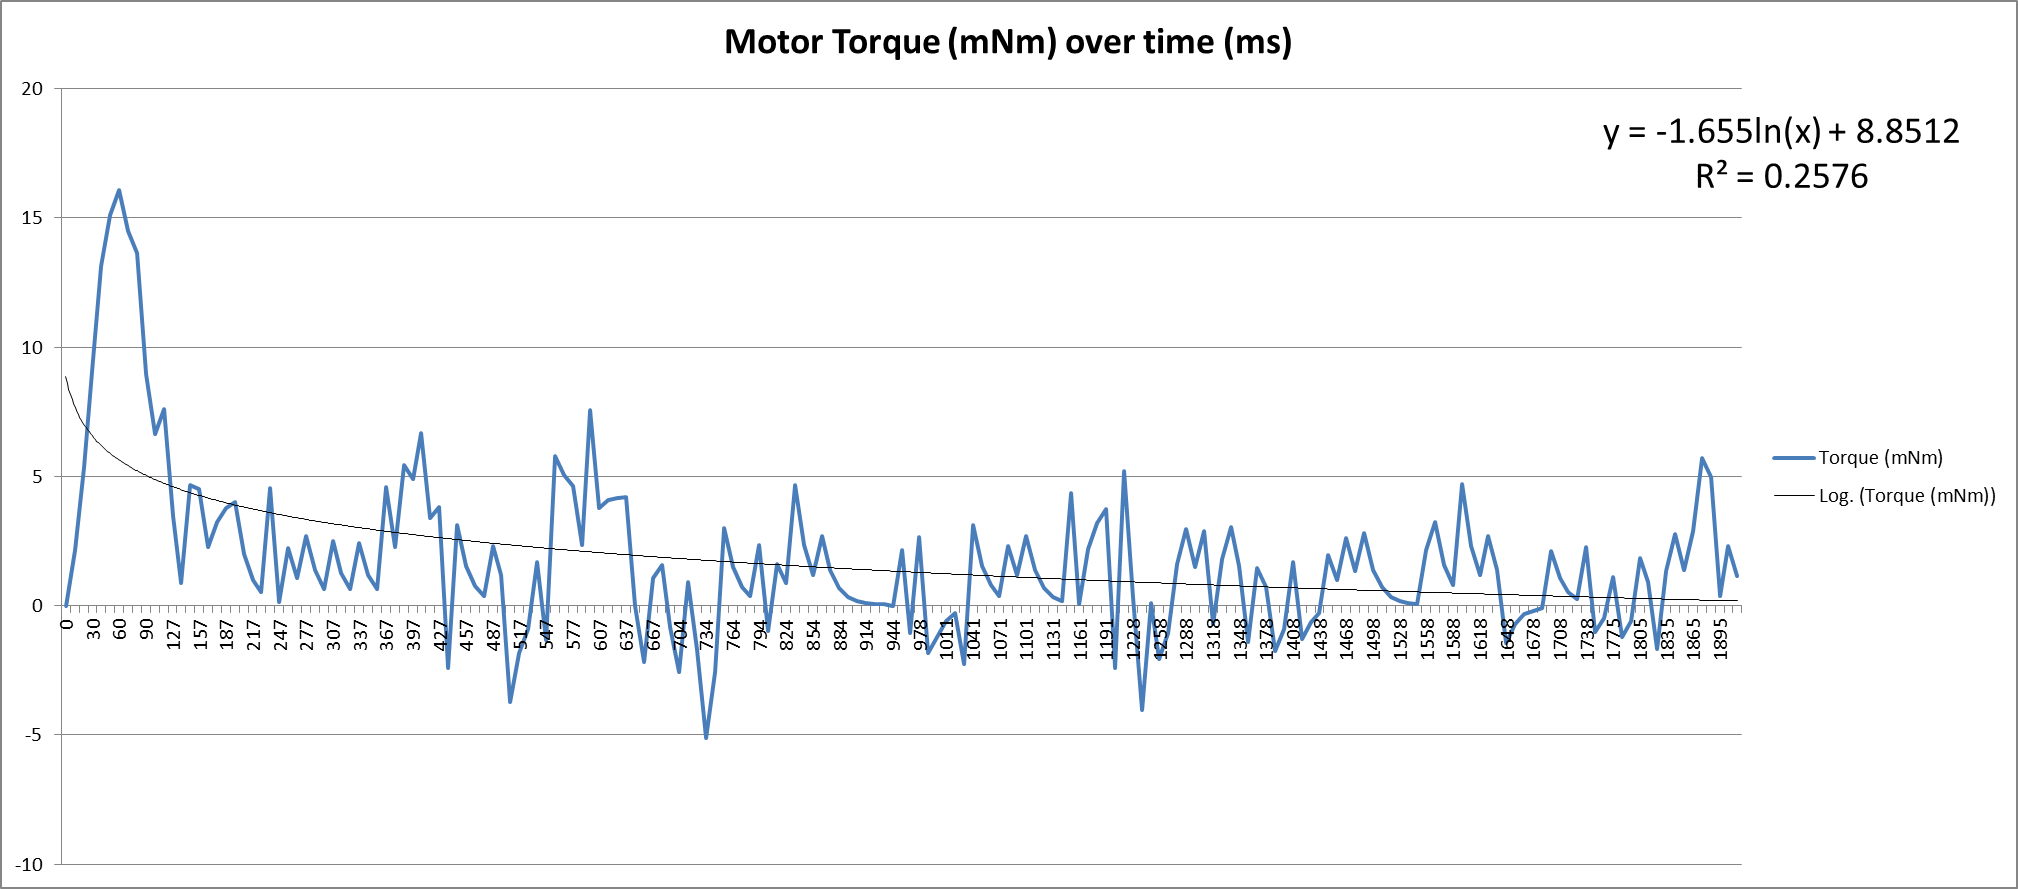
The torque value we calculated is not the raw torque output of the motor, but the torque value after resistive forces such as air friction, mechanical friction and tyre friction etc..
The shape of the torque curve seems to look like a logarithmic curve. So I applied regression with a logarithmic curve and see how well it fits (black line). It fits with R2 of 0.26. Not a very good fit, but the data does seem to fit the line quite well. What do you think?
Let’s see what we get if we calculate the average of all the torque values on this curve. I added up all the values and divided them by the number of values, the result is 1.81 mNm. Now, let’s compare this with the torque value listed on the packaging (1.4 – 1.9mNm). The value we calculated based on our measurement is within the range of the values from the packaging. Not bad at all!
But we also observe that the torque was the highest at the beginning, with value around 16.1 mNm, which is many times over the values from the packaging.
Motor RPM
We can calculate the RPM of the motor based on the speed of the car.
Speed (in metre per second) = Motor RPM / gear ratio / 60 × Diameter of the wheel (in metre) × Pi
So: Motor RPM = Speed (m/s) × gear ratio × 60 / diameter of the wheel (in metre) / Pi
Let’s plot the motor RPM and motor torque values over time in a chart. We get:
Left vertical axis is motor RPM and right vertical axis is motor torque.
The top RPM we measured and derived is 19375. Let’s compare it with the values from the packaging (RPM range 17,200 to 21,200). The value we got is within range. Not bad for a 2018 motor!
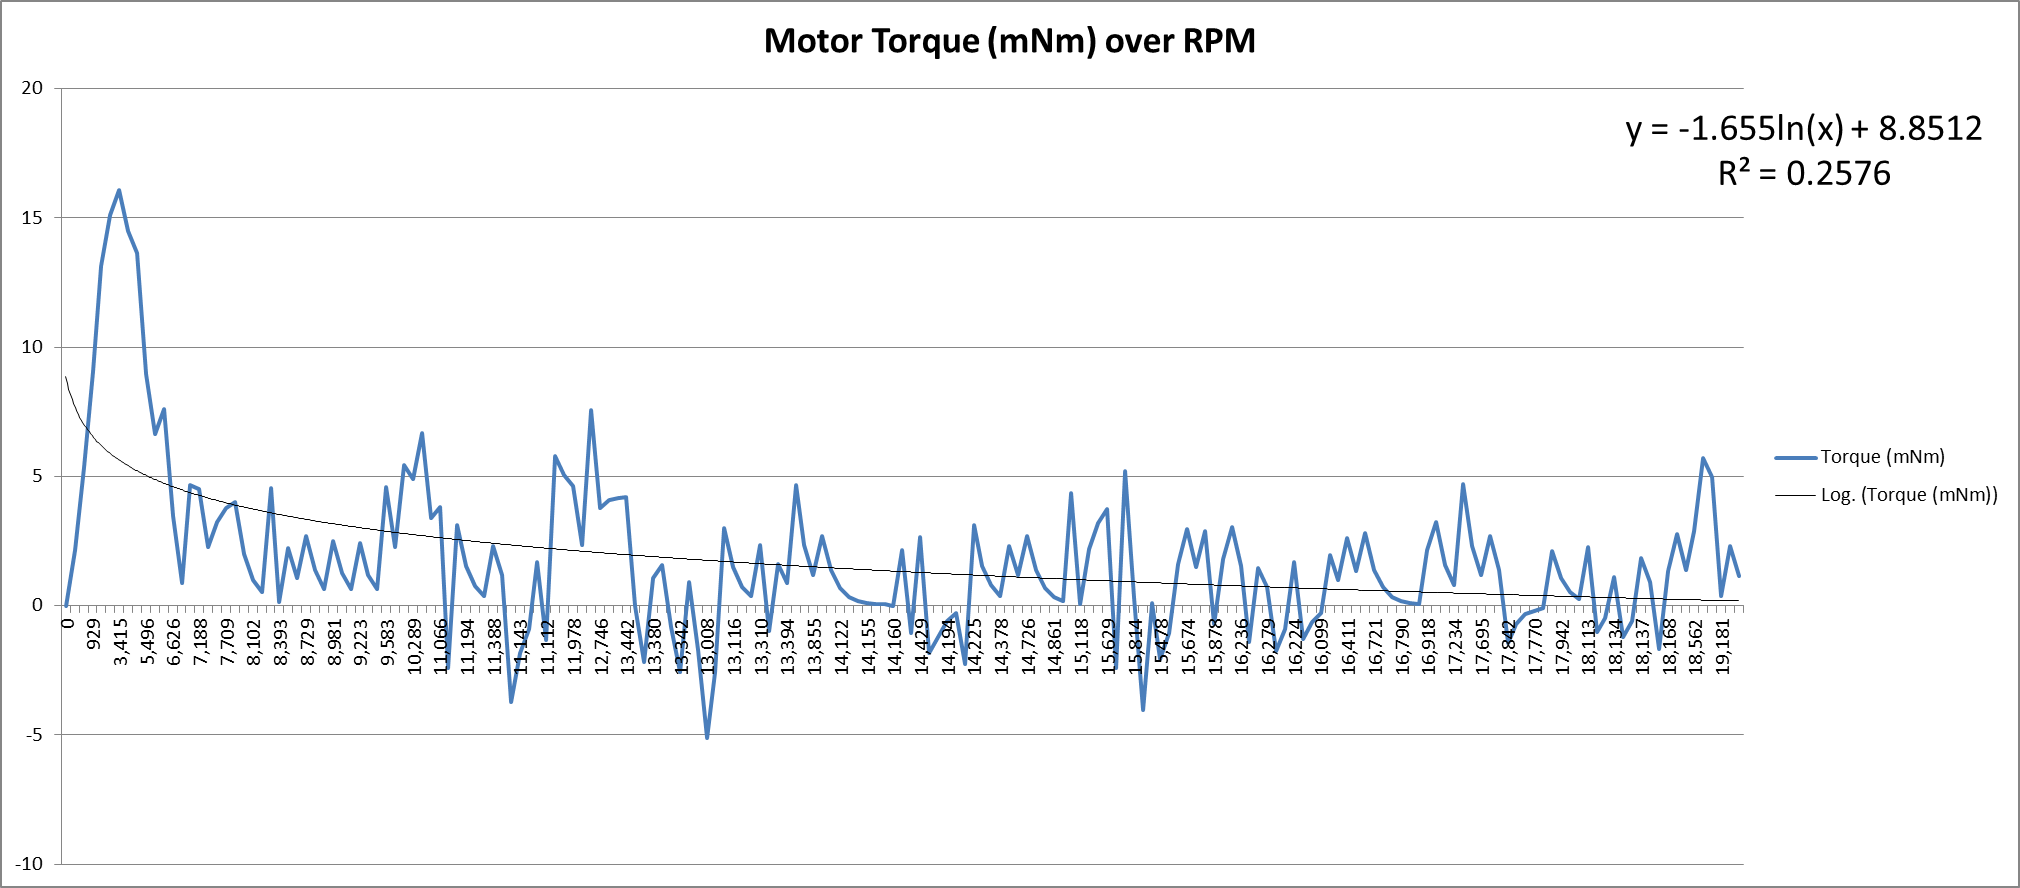
Motor Torque per RPM
Let’s plot another chart with the values we have got so far, but this time we put motor torque and RPM together. We get motor torque over motor speed (RPM) chart:
What does the result mean to fellow racers?
From our experiment, we can conclude that the RPM and torque of our 2018 Tamiya Hyper Dash PRO motor is in range with the values listed on the packaging. We observed that the acceleration of the motor is not linear and the torque delivered is quite volatile. There is a strong initial push and then it tails off. As a result, it adds variance to your setup and it could be the reason why sometimes your car jumped over an obstacle and landed perfectly and sometimes it didn’t.
Validation
Upon checking the result, there seems to be an issue. The car measured a distance of 899.9cm, but when I calculated distance based on the size of the track parts, it is 713cm. So why is there such discrepancy? Given the accuracy of the tachometer is pretty good (as tested above), then one explanation is that the tyres were slipping. Can I tell when and where the tyres were slipping? I am not sure. Perhaps I could get some insight by analysing the forward acceleration data. In the meantime, should we scale down the top speed of the car based on the calculated distance? Perhaps we should hold that thought since we don't know how much slipping was there over the test period and whether the tyres slipped when it reached top speed. We need to examine the data further and perhaps to setup another experiment to check the level of tyres slip. So watch this space.
In summary
We measured the performance of our Tamiya Hyper-Dash PRO Japan cup 2018 motor. We compared our measurements with the information on the packaging. We found that our values are within range of the values listed on the packaging. We also learnt about the performance characteristics of the motor. The torque curve of the motor is not linear with the biggest push at the beginning of the RPM range.
We observed that the motor torque is quite volatile, which could add some variance to performance consistency.
This experiment is by no means conclusive. We need to run more tests to get a more accurate picture. Your setup might be different from ours which will create different results. But we hope that it provides you an interesting insight to the subject matter.
What would you take away from this experiment? How would you improve it? What would you like us to test next time? Please feel free to leave a comment on our Facebook page @Mini4Science.
Feel free to download the data and explore yourself. <download data in CSV>
Further reading
A few months after this report, we ran a more thorough performance tests on the Tamiya Hyper-Dash PRO motor. You can find the report here. If you are interested in learning more about the performance of each Tamiya PRO motors and how do they compare with each other, please feel free to check out our latest motor performance test series.
![7 different Tamiya Mini 4WD low profile small diameter tyres [Item no: 95208, 95205,95152, 95281, 95304]](https://mini4science.com/wp-content/uploads/2024/09/IMG_0538_mod2-150x150.jpg)
![8 different Tamiya Mini 4WD metal rollers [Item no: 95612, 15522, 95643, 95497, 15426, 95160, 15345, 15475]](https://mini4science.com/wp-content/uploads/2024/07/IMG_0296-150x150.jpg)


![7 different Tamiya Mini 4WD low profile small diameter tyres [Item no: 95208, 95205,95152, 95281, 95304]](https://mini4science.com/wp-content/uploads/2024/09/IMG_0538_mod2.jpg)
![8 different Tamiya Mini 4WD metal rollers [Item no: 95612, 15522, 95643, 95497, 15426, 95160, 15345, 15475]](https://mini4science.com/wp-content/uploads/2024/07/IMG_0296-scaled.jpg)